6. Measurement example
54
6.4.3 Reading out data
1
Mark the required location or protocol.
2
Hold the icon with the right mouse button and drag from the archive area to the work
area on the right. The long-term measurement results are then shown in the table.
Data can be shown in different forms: diagram, table, histogram.
The file can be saved under File -> Save and
printed under File -> Print.
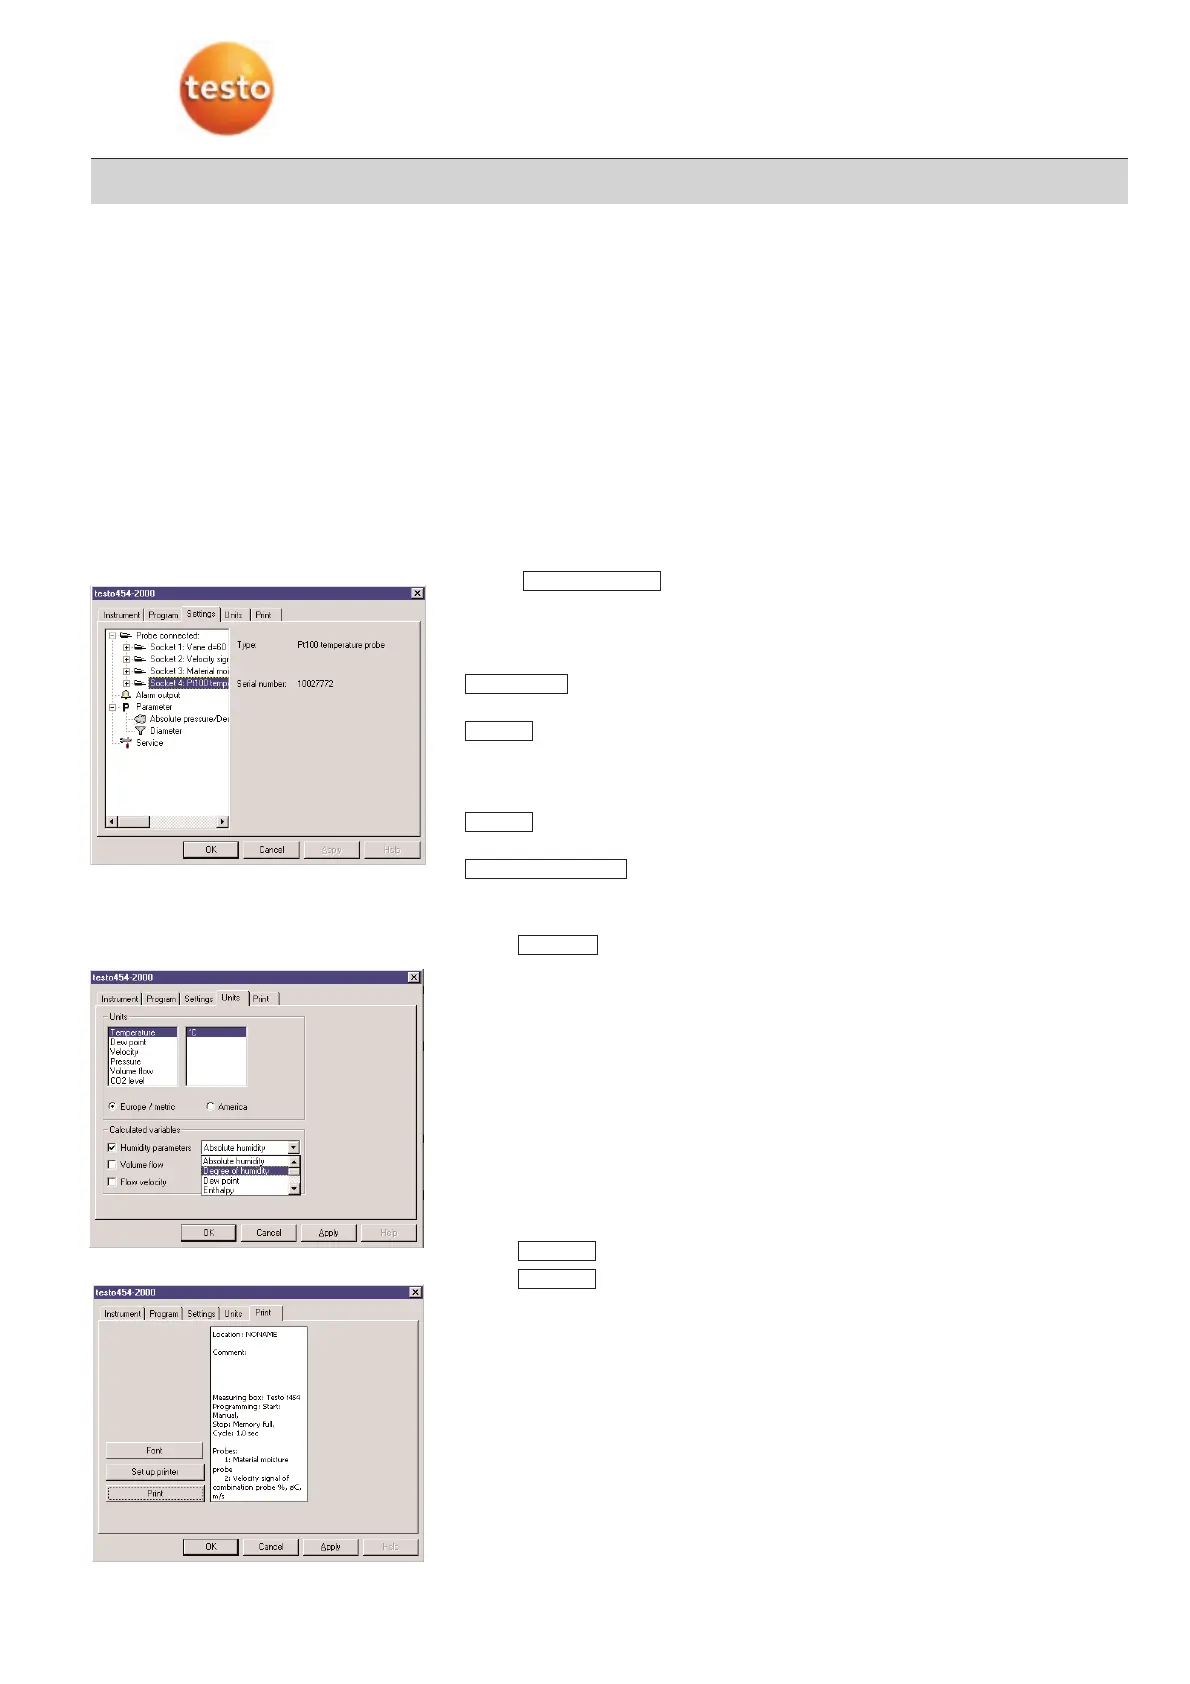
6.4.4 Additional setting options
1
Select Device -> Device control.
2
Select register:
-
This window shows information on the probes connected and the corresponding
channels.
The following settings are possible:
·:
Carry out settings on pressure measurement and the cross-section.
·:
Cancel memory inside logger
Carry out factory reset
Change probes.
·:
Add specific short text.
·:
You will receive error messages or information on the condition of the logger.
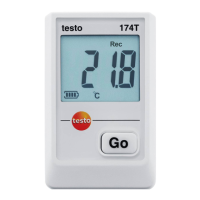
3
Select register.
You can:
· determine units.
· specify an additional calculated absolute humidity variable.
· activate a volume flow.
· activate flow velocity.
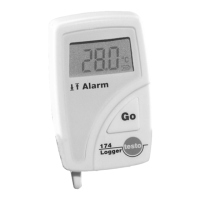
1
Select register.
2
Select button
-
A sheet is printed containing all the important information about this measuring pro-
gram.
Print
Print
Units
Check ddevice
Name
Service
Parameter
Settings