Using IAR Embedded Workbench
www.ti.com
78
SWRU271H–October 2010–Revised April 2019
Submit Documentation Feedback
Copyright © 2010–2019, Texas Instruments Incorporated
Development and Debugging
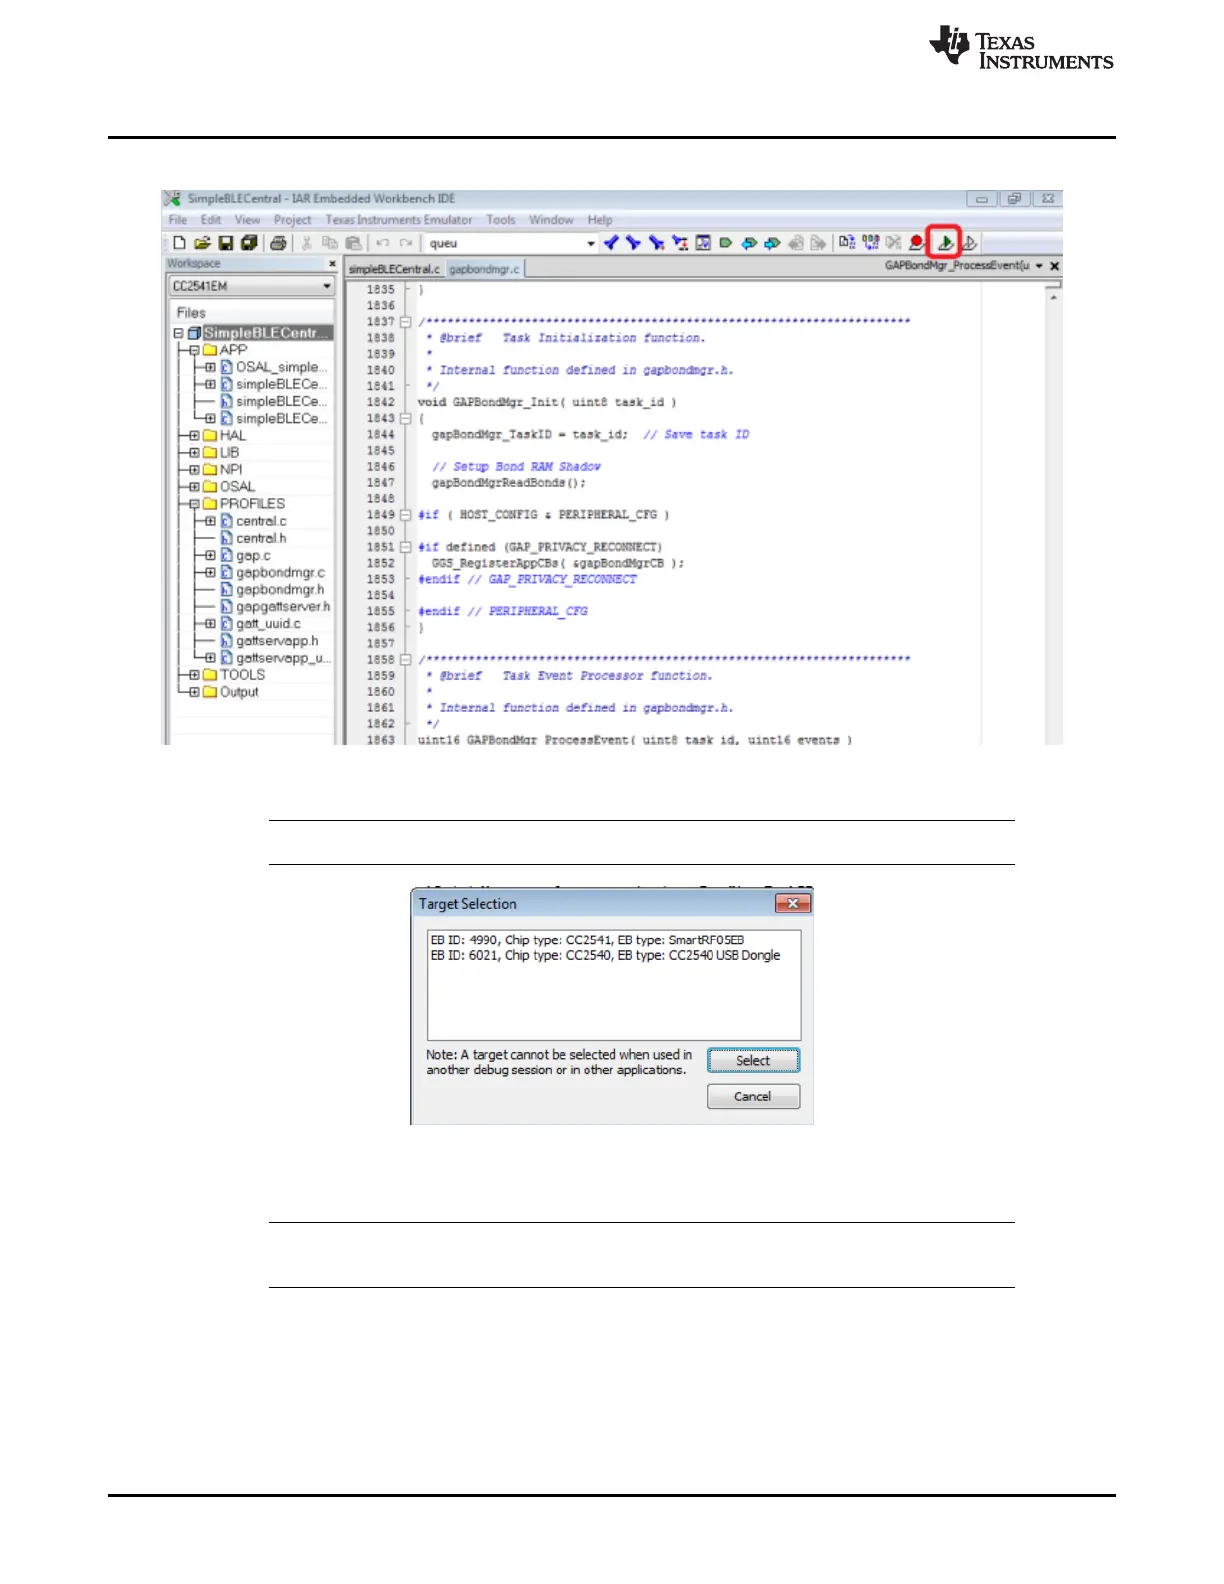
4. Find the Debug button on the upper-right side of the IAR window, see Figure 8-8.
Figure 8-8. Debug Button in IAR
NOTE: If there are multiple debug devices connected, Figure 8-9 appears to select a device
Figure 8-9. Target Selection
5. Select a device.
NOTE: After selecting a device, the code downloads. When the code is downloaded, a toolbar with
the debug commands appears in the upper-left corner of the screen.
6. Click the Go button on the toolbar to execute the program, see Figure 8-10.