included.
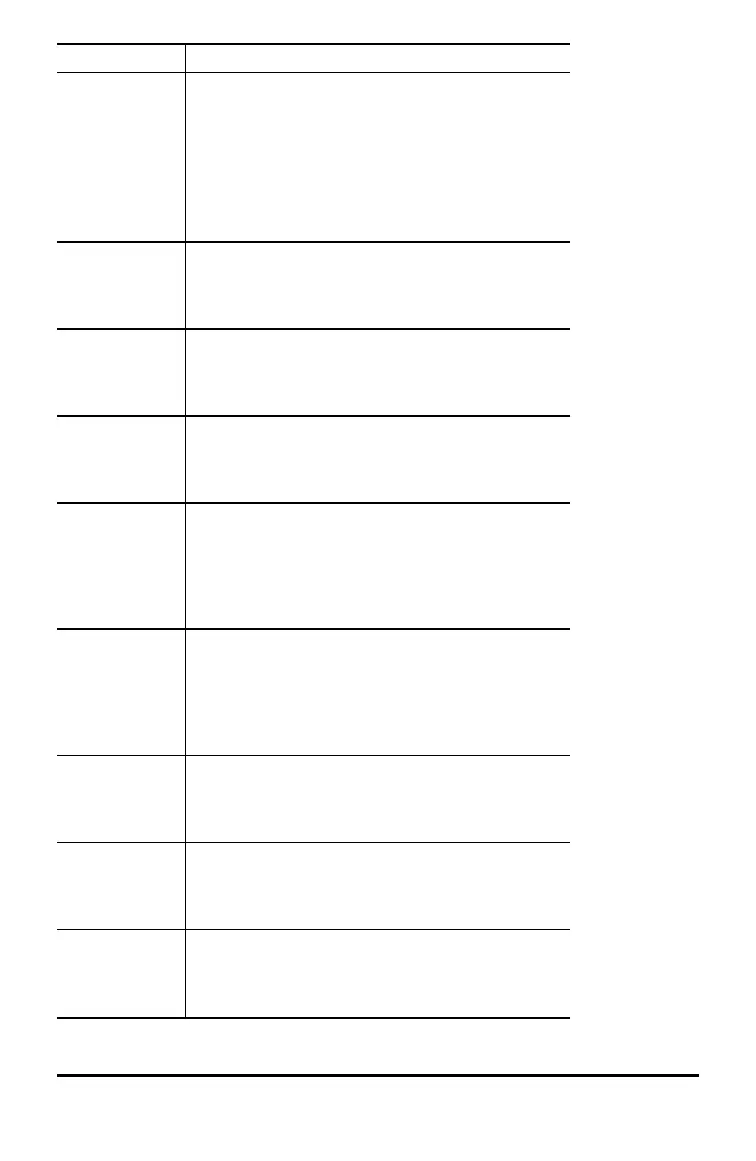
3:2-VAR STATS Analyses paired data from 2 data sets with 2
measured variables—x, the independent variable,
and y, the dependent variable. Frequency data
may be included.
Note: 2-Var Stats also computes a linear
regression and populates the linear regression
results. It displays values for a (slope) and b (y-
intercept); it also displays values for r
2
and r.
4:LinReg ax+b Fits the model equation y=ax+b to the data using a
least-squares fit for at least two data points. It
displays values for a (slope) and b (y-intercept); it
also displays values for r
2
and r.
5:PropReg ax Fits the model equation y=ax to the data using
using least squares fit for at least one data point.
It displays the value for a. Supports data forming a
vertical line with the exception of all 0 data.
6:RecipReg
a/x+b
Fits the model equation y=a/x+b to the data using
least squares fit on linearised data for at least two
data points. It displays values for a and b; it also
displays values for r
2
and r.
7:QuadraticReg Fits the second-degree polynomial y=ax
2
+bx+c to
the data. It displays values for a, b, and c; it also
displays a value for R
2
. For three data points, the
equation is a polynomial fit; for four or more, it is
a polynomial regression. At least three data points
are required.
8:CubicReg Fits the third-degree polynomial y=ax
3
+bx
2
+cx+d
to the data. It displays values for a, b, c, and d; it
also displays a value for R
2
. For four points, the
equation is a polynomial fit; for five or more, it is a
polynomial regression. At least four points are
required.
9:LnReg a+blnx Fits the model equation y=a+b ln(x) to the data
using a least squares fit and transformed values ln
(x) and y. It displays values for a and b; it also
displays values for r
2
and r.
:PwrReg ax^b Fits the model equation y=ax
b
to the data using a
least-squares fit and transformed values ln(x) and
ln(y). It displays values for a and b; it also displays
values for r
2
and r.
:ExpReg ab^x Fits the model equation y=ab
x
to the data using a
least-squares fit and transformed values x and ln
(y). It displays values for a and b; it also displays
values for r
2
and r.
Math Functions 31
 Loading...
