If the teacher adds 4 points to Test 4, Anthony’s average grade is 12.
³ Problem
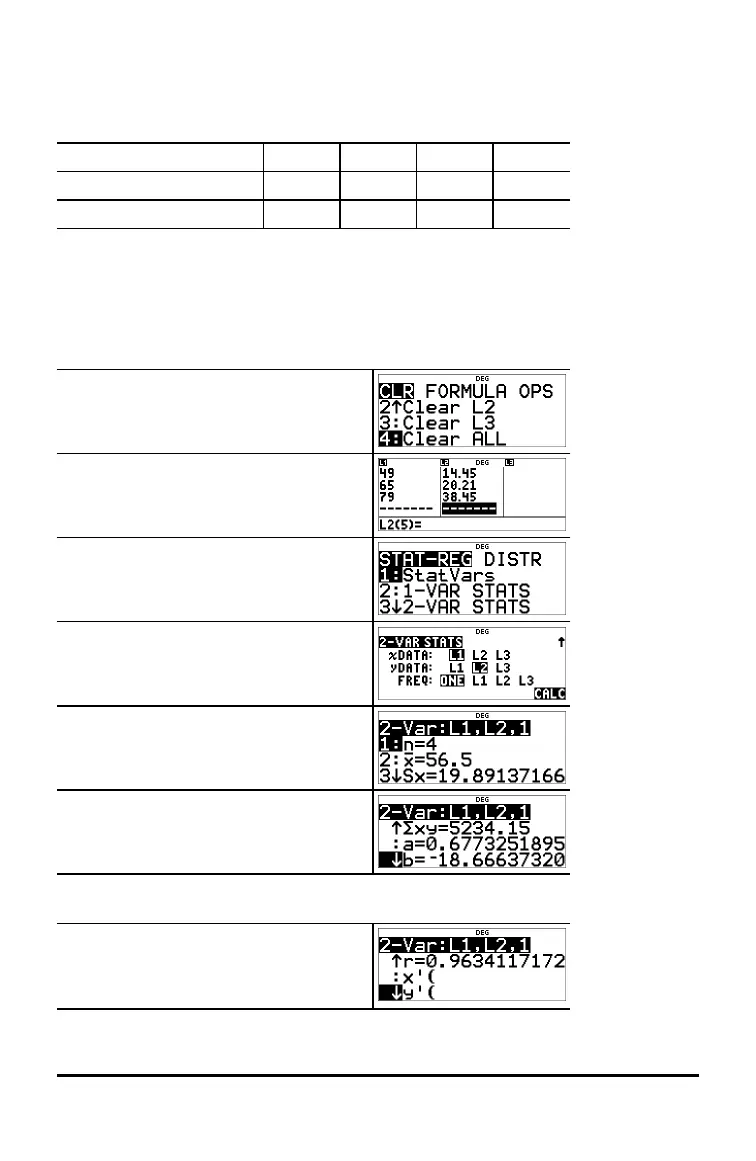
The table below gives the results of a braking test.
Test No. 1 2 3 4
Speed (kph) 33 49 65 79
Braking distance (m) 5.30 14.45 20.21 38.45
Use the relationship between speed and braking distance to estimate the braking
distance required for a vehicle travelling at 55 kph.
A hand-drawn scatter plot of these data points suggest a linear relationship. The
calculator uses the least squares method to find the line of best fit, y'=ax'+b, for data
entered in lists.
v v $ $ $
<
33 $ 49 $ 65 $ 79 $ " 5.3 $ 14.45
$ 20.21 $ 38.45 <
% s
% u
3 (Selects 2-VAR STATS)
$ $ $
<
Press $ as necessary to view a and b.
This line of best fit, y'=0.67732519x'N18.66637321 models the linear trend of the data.
Press $ until y' is highlighted.
Math Functions 37
 Loading...