You can use the following statistics functions:
Description Keys
Best fit equations (regressions)
…CALC menu
… ~ } †
Define and store up to three stat plot definitions y ,
Distributions y =
List-based statistical analysis
y 9MATH menu
y 9 ~ ~
Logistic and sine regression analysis
…CALC menu
… ~ } †
One- and two-variable analysis
…CALC menu
… ~ À and … ~ Á
Statistical tests
…TEST menu
… ~ ~
Inferential Statistics
You can perform 16 hypothesis tests and confidence intervals and 15 distribution
functions. You can display hypothesis test results graphically or numerically.
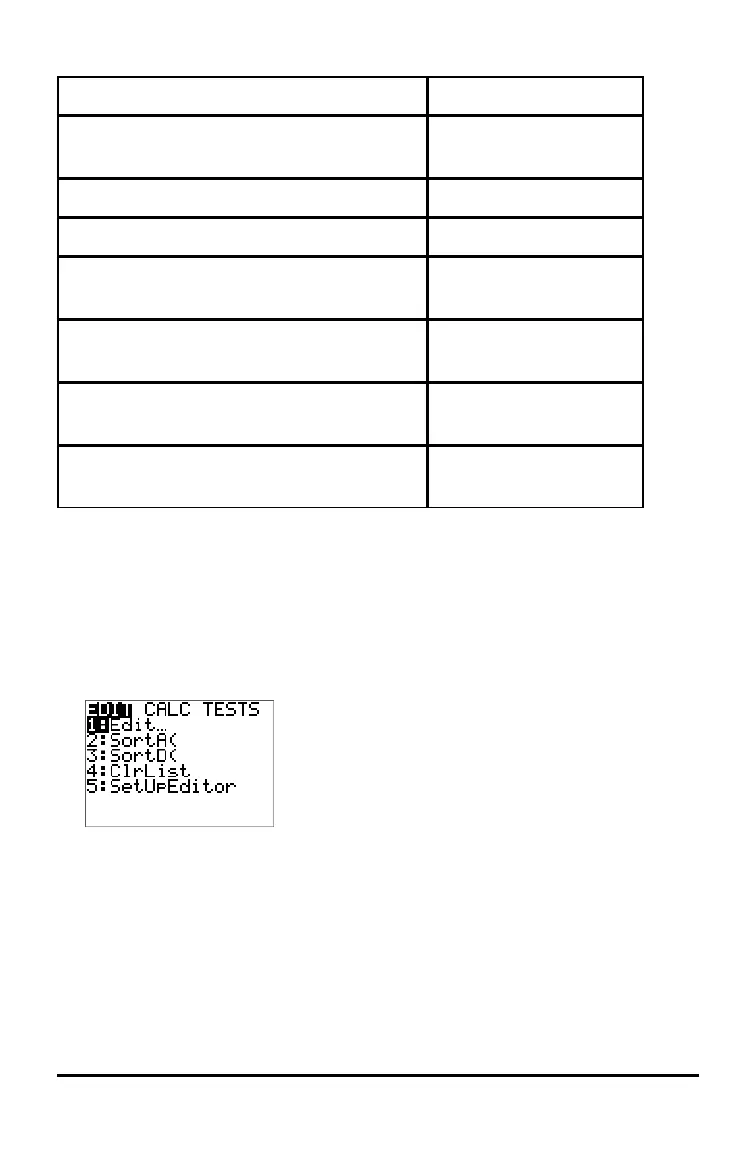
To enter lists of data:
1. Press ….
2. Select 1: Edit in the EDIT submenu, then Í.
3. Enter your data into list columns.
Note: Once in the list editor, use the arrow keys to enter the data in the lists. L1 – L6
are built-in list names.
Working with Probability and Statistics 33




 To Next Page