34 Working with Probability and Statistics
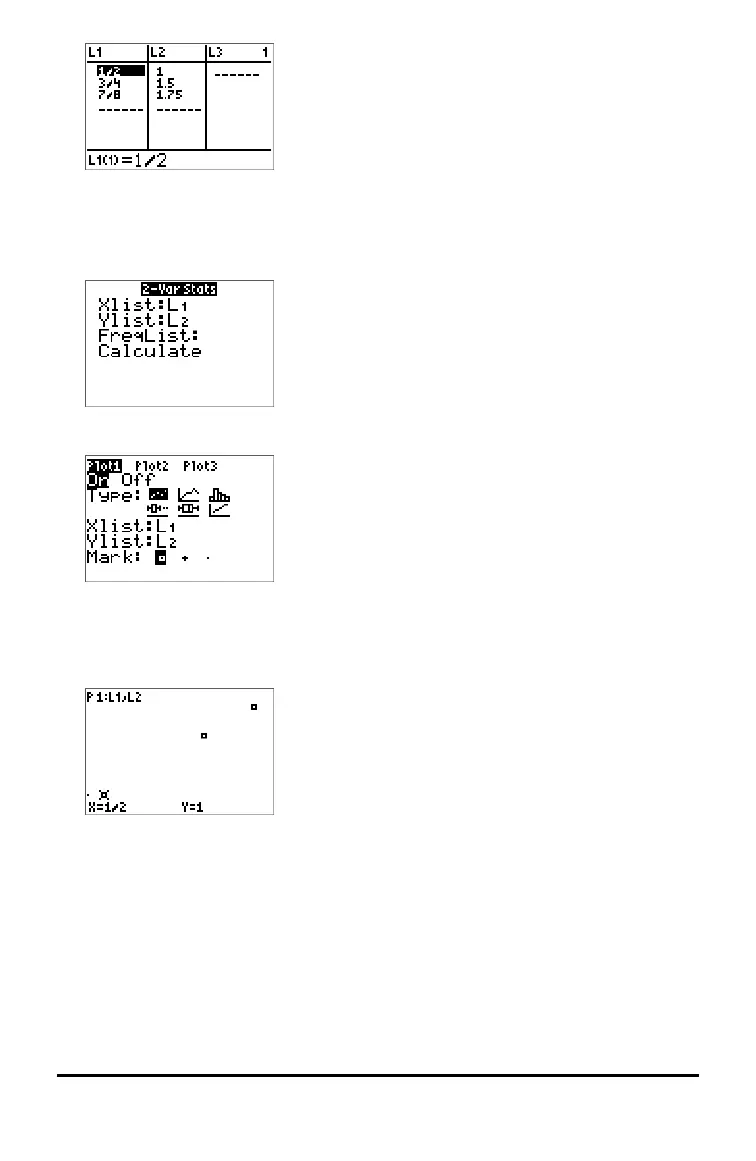
To plot this data:
4. Press y ,.
5. Press 1: Plot1 (to set up a scatter plot for L1 and L2), then Í.
6. Press | to highlight On. Press Í.
7. Press q to automatically set up a graphing window for your data.
8. Press 9: ZoomStat to see the graph.
9. Press r and arrow keys to trace on the plot.
Note: You can plot your statistics data in these ways:
• Scatter plot
• xyLine
• Histogram
• Regular or Modified box-and-whisker plot
• Normal probability plot




 To Next Page