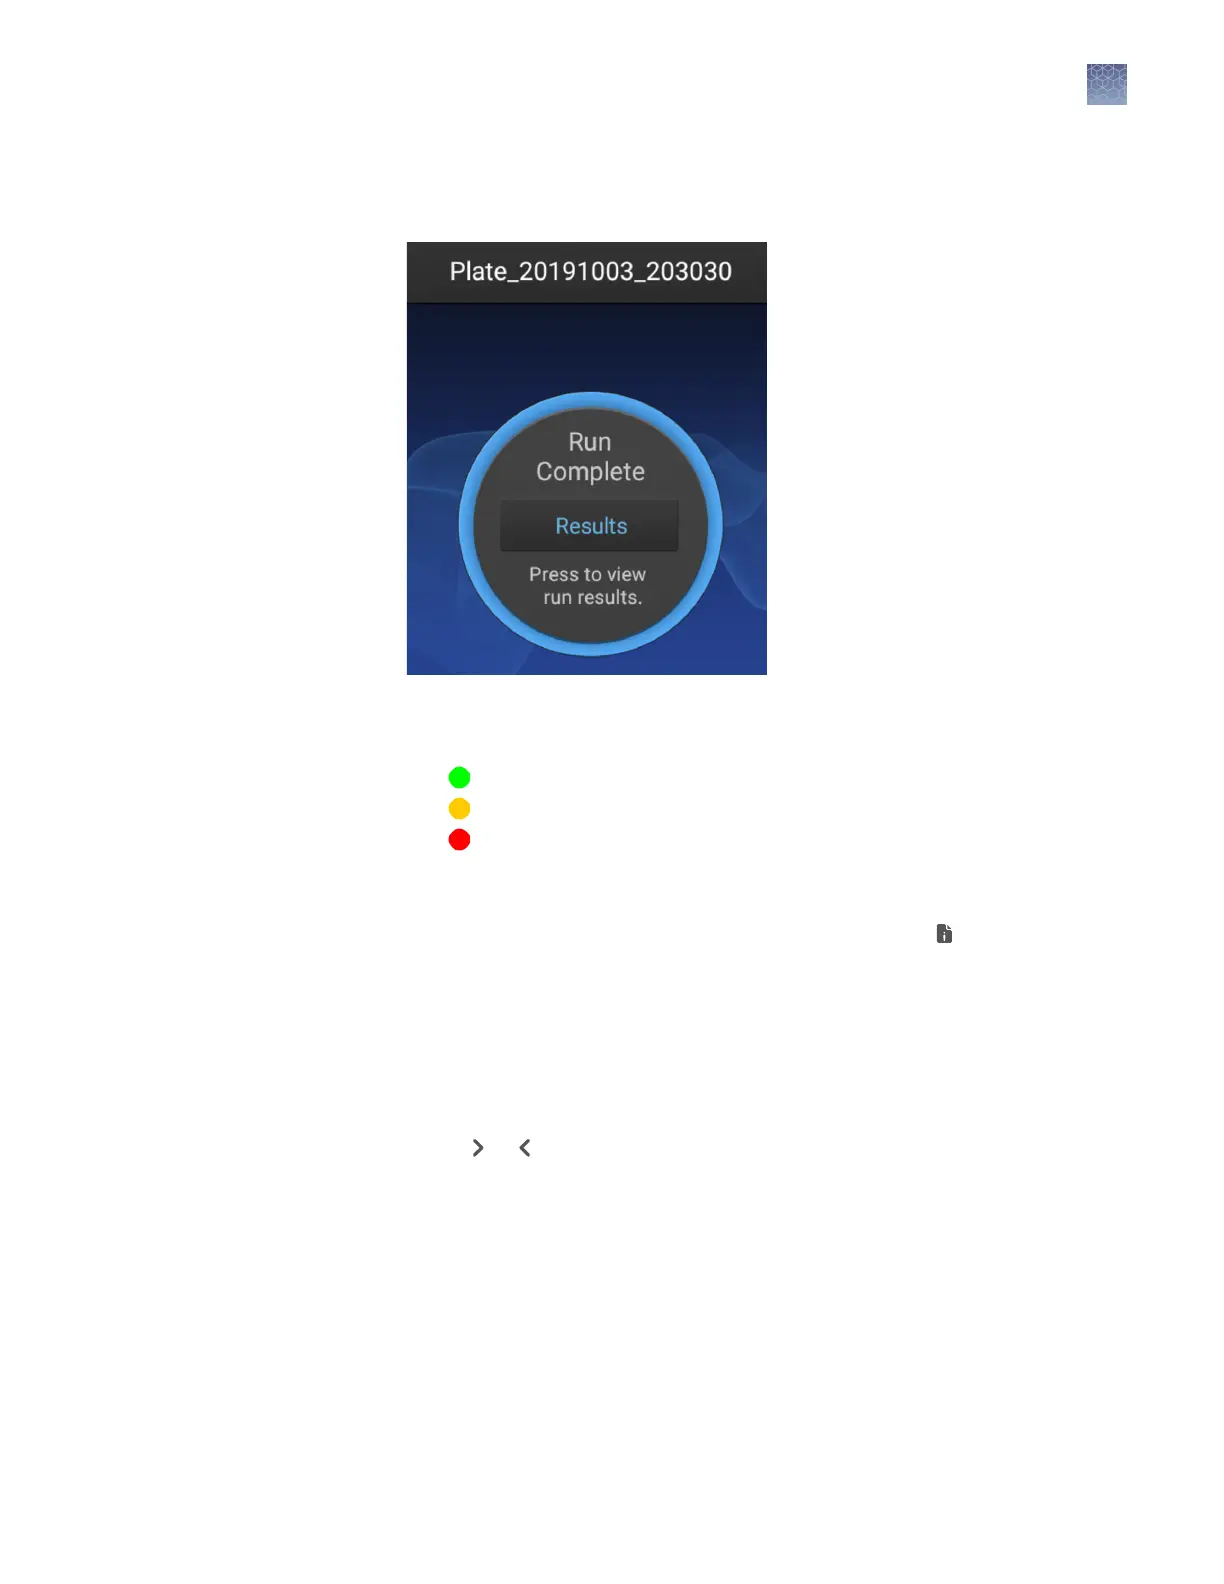
View results for the plate when the run is completed (all injections are nished).
1.
Touch Results to view the run results.
Common Callouts and Arrows
1. Copy-paste a callout or arrow to use in this SVG.
Note: If you need more advanced callouts or arrows
use the TechComm_Inkscape_Callout&Arrow_Libary.
3. Delete this text, this rectangle, and unused
callouts, arrows, or other SVG elements
before adding this SVG to the repository.
2. Edit number and/or line-length, as needed.
1 1
1
1
2.
Touch List view.
Each injection group displays a QC color for each capillary:
• —All QC tests passed.
• —At least 1 warning quality alert was triggered.
• —At least 1 failing quality alert was triggered.
3.
Touch an injection group.
4.
View the results in the Run Result Details screen, or touch for well details.
5.
Touch a sample le name.
6.
Touch and drag the thumbnail view of the analyzed trace (below the trace) to
scroll left or right.
7.
(Optional) Adjust the graphical view (see “Adjust the trace display“ on page 48).
8.
Touch or to scroll to the raw data or EPT Plot (ElectroPhoresis Telemetry).
View results when
the run is
completed
Chapter 5 Start and monitor a run
Monitor a run from the instrument
5
SeqStudio
™
Genetic Analyzer Instrument and Software Getting Started Guide
41
 Loading...