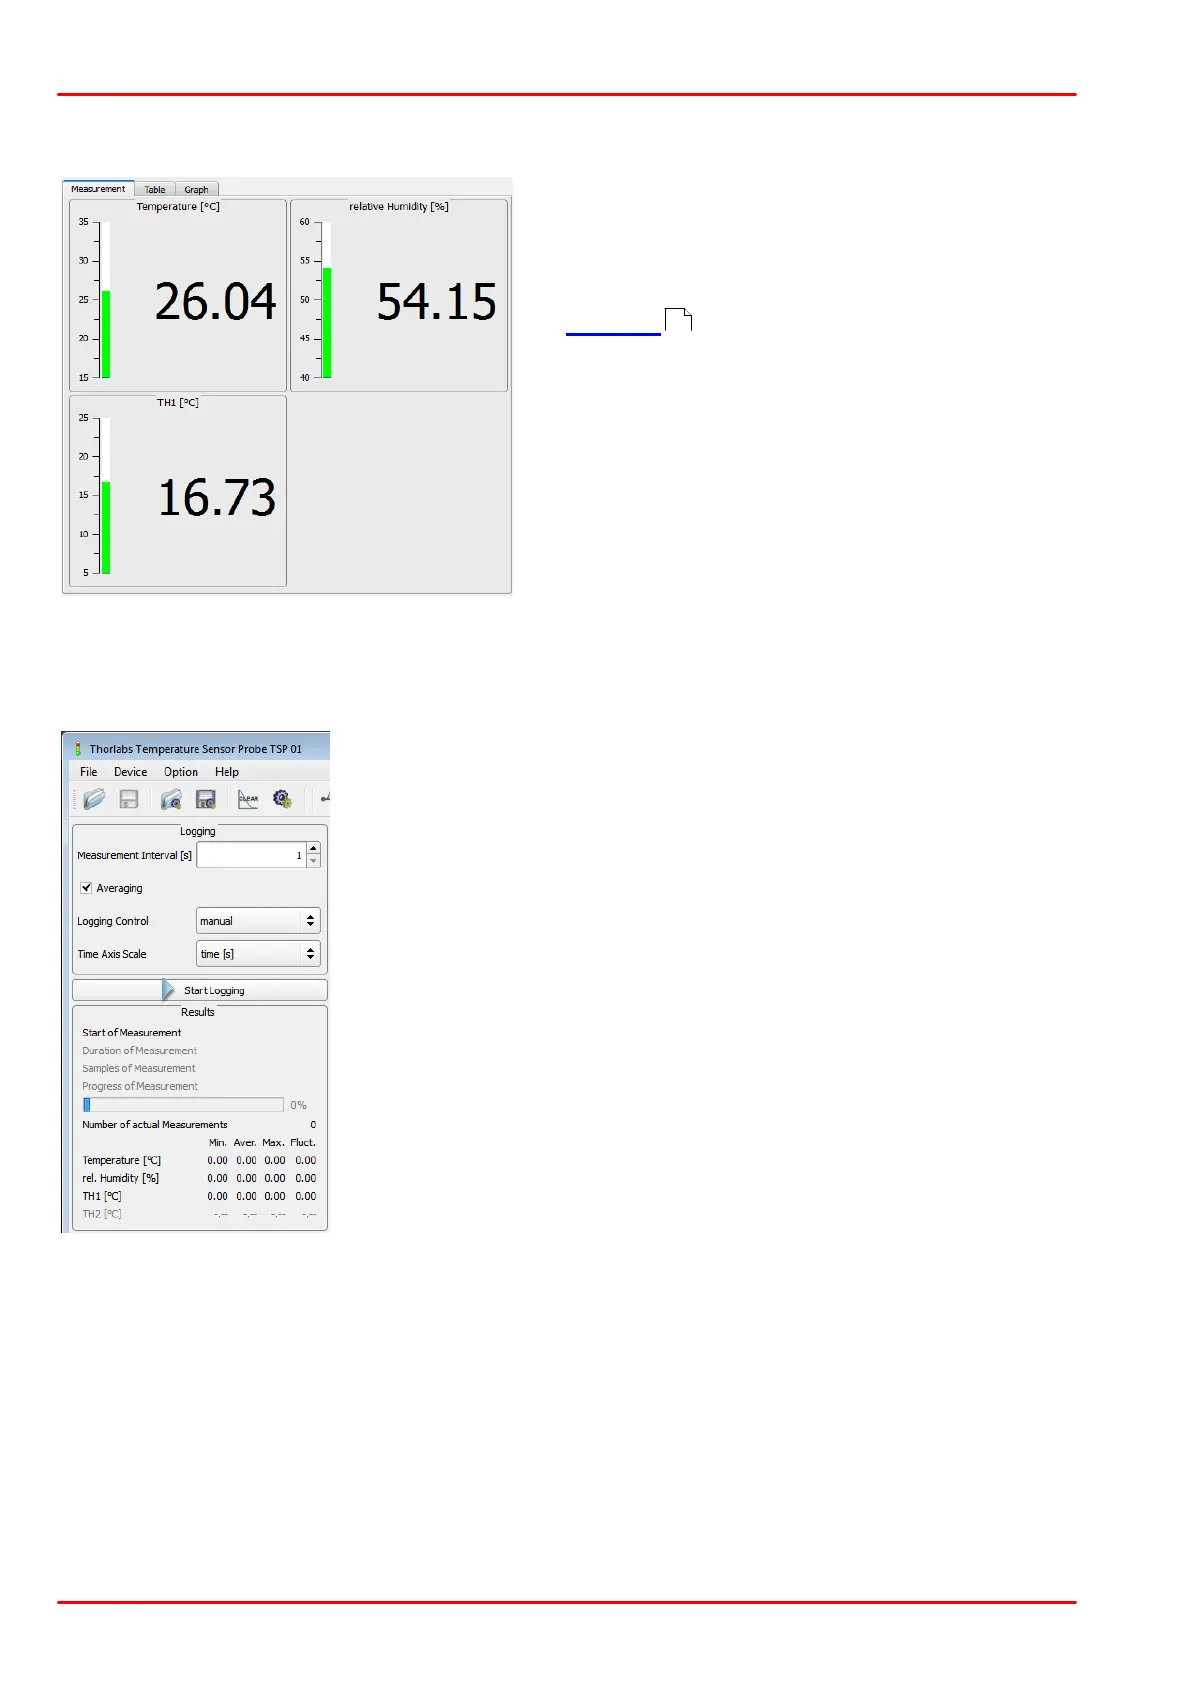
The Measurement tab displays the actual mea-
surement values of all enabled sensors in numeri-
cal values and within a bar.
The bar indication range can be set individually in
the Settings menu. Additionally, two limits can
be defined for each bar that control the bar color
(blue - green - red) depending on the actual value
with respect to these two limits.
.
· Logging Control: Choose between: manual start/stop, timed log-
ging or logging of a number of samples.
· Measurement Interval: Set the logging interval (time between two
measurements) between 1 and 10000 seconds.
· Averaging: Averaging unchecked: A single measured value per
selected measurement interval will be logged.
Averaging checked: All values that are measured each second
within the selected measurement interval will be averaged and
only this average value will be logged. Only one single value will
be logged for both options.
· Time Axis Scale: Three selections are available: time in seconds,
time in hh:mm:ss and time stamp (date and time). The complete
time stamp will be displayed only in the Table Tab.
· Start / Stop Logging: This is a toggle button to start / stop log-
ging.
· Results: In this pane logging statistics are displayed.