.
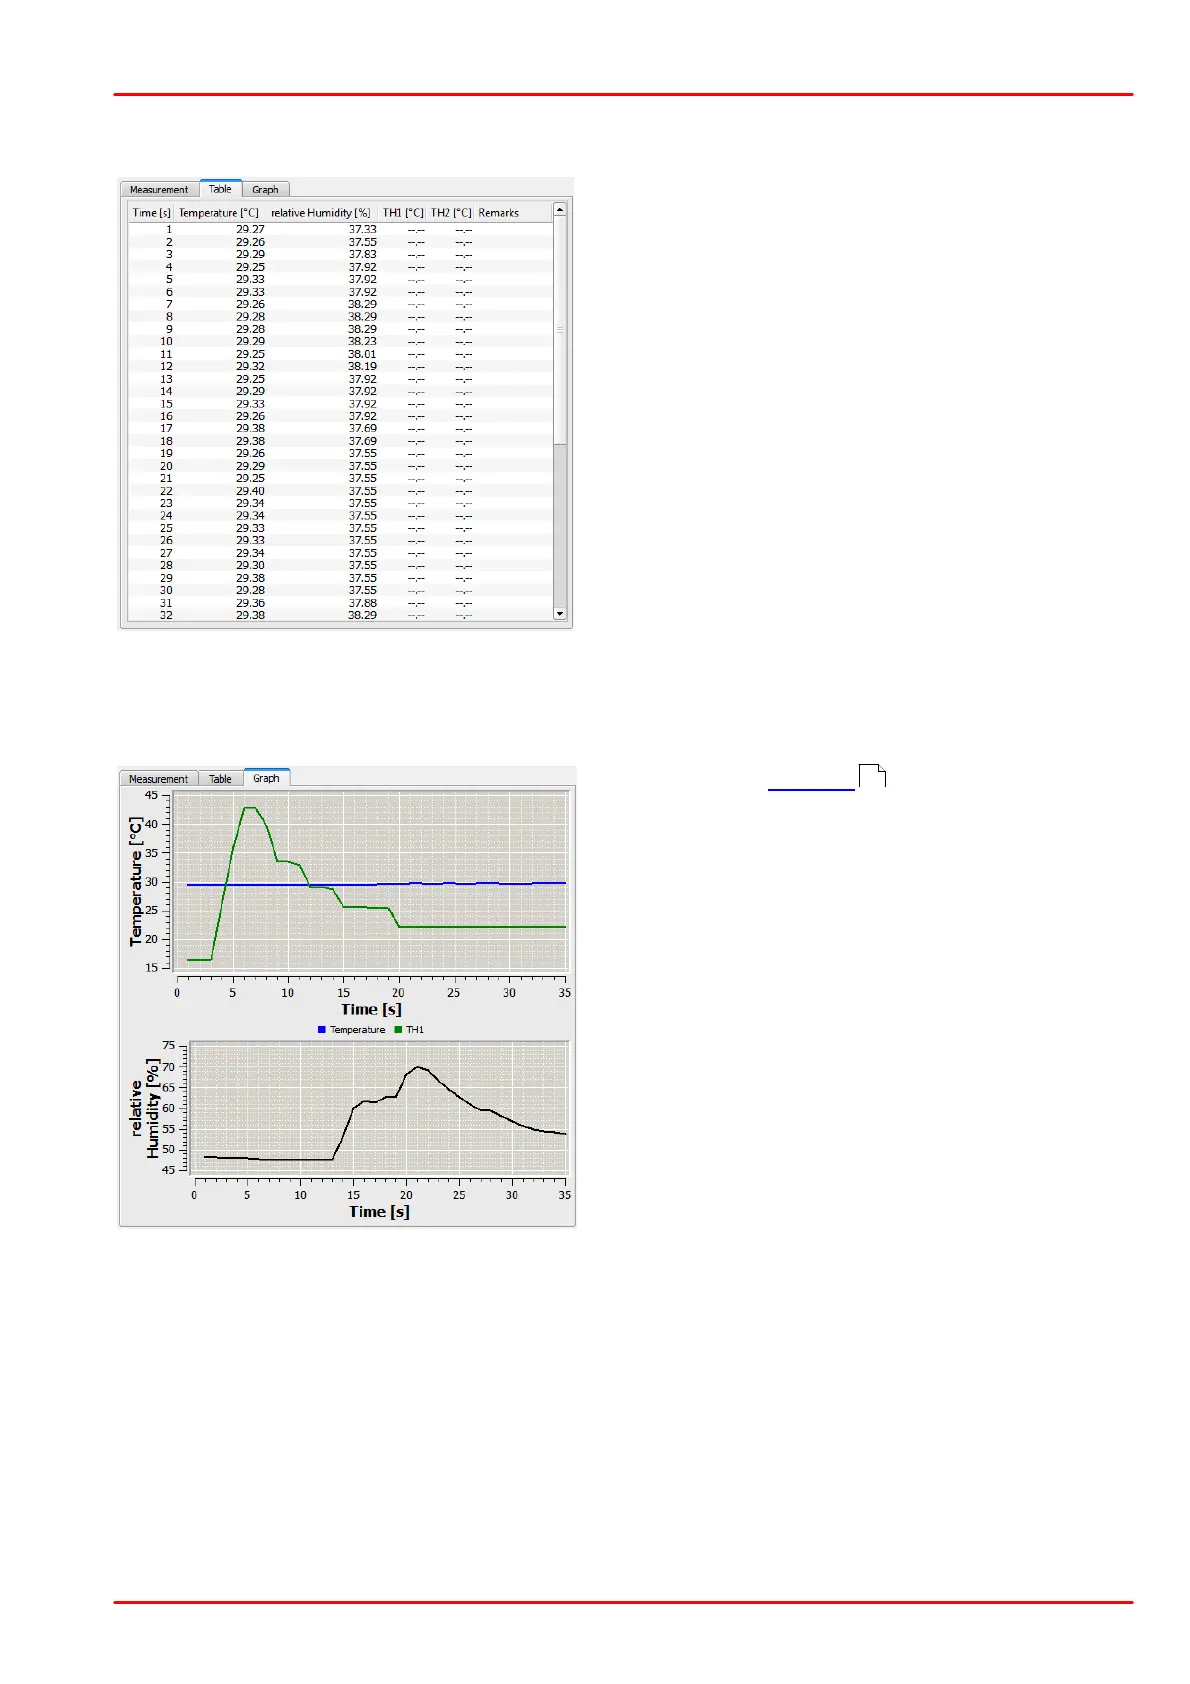
In the tab Table all logged data versus time are
displayed numerically.
Column description:
Time: Format as selected for "Time Axis Scale"
Results: The values from all sensors are dis-
played. If an external sensor is not enabled or not
present, the values show "--.---"
Remarks: This column is empty if no error oc-
curred. Otherwise, an error message will be dis-
played.
.
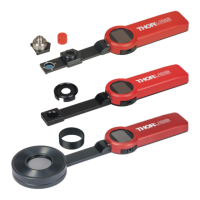
If enabled in the Settings menu, the tab Graph,
will display all logged data versus time.
Temperature: Up to three curves can be dis-
played: blue for internal sensor, green for external
sensor TH1 and red for external sensor TH2.
Rel. Humidity: If enabled, the relative humidity
value versus time will be shown in black color.