CA-200F Corneal Analyser - Rev. 7 16/01/2012
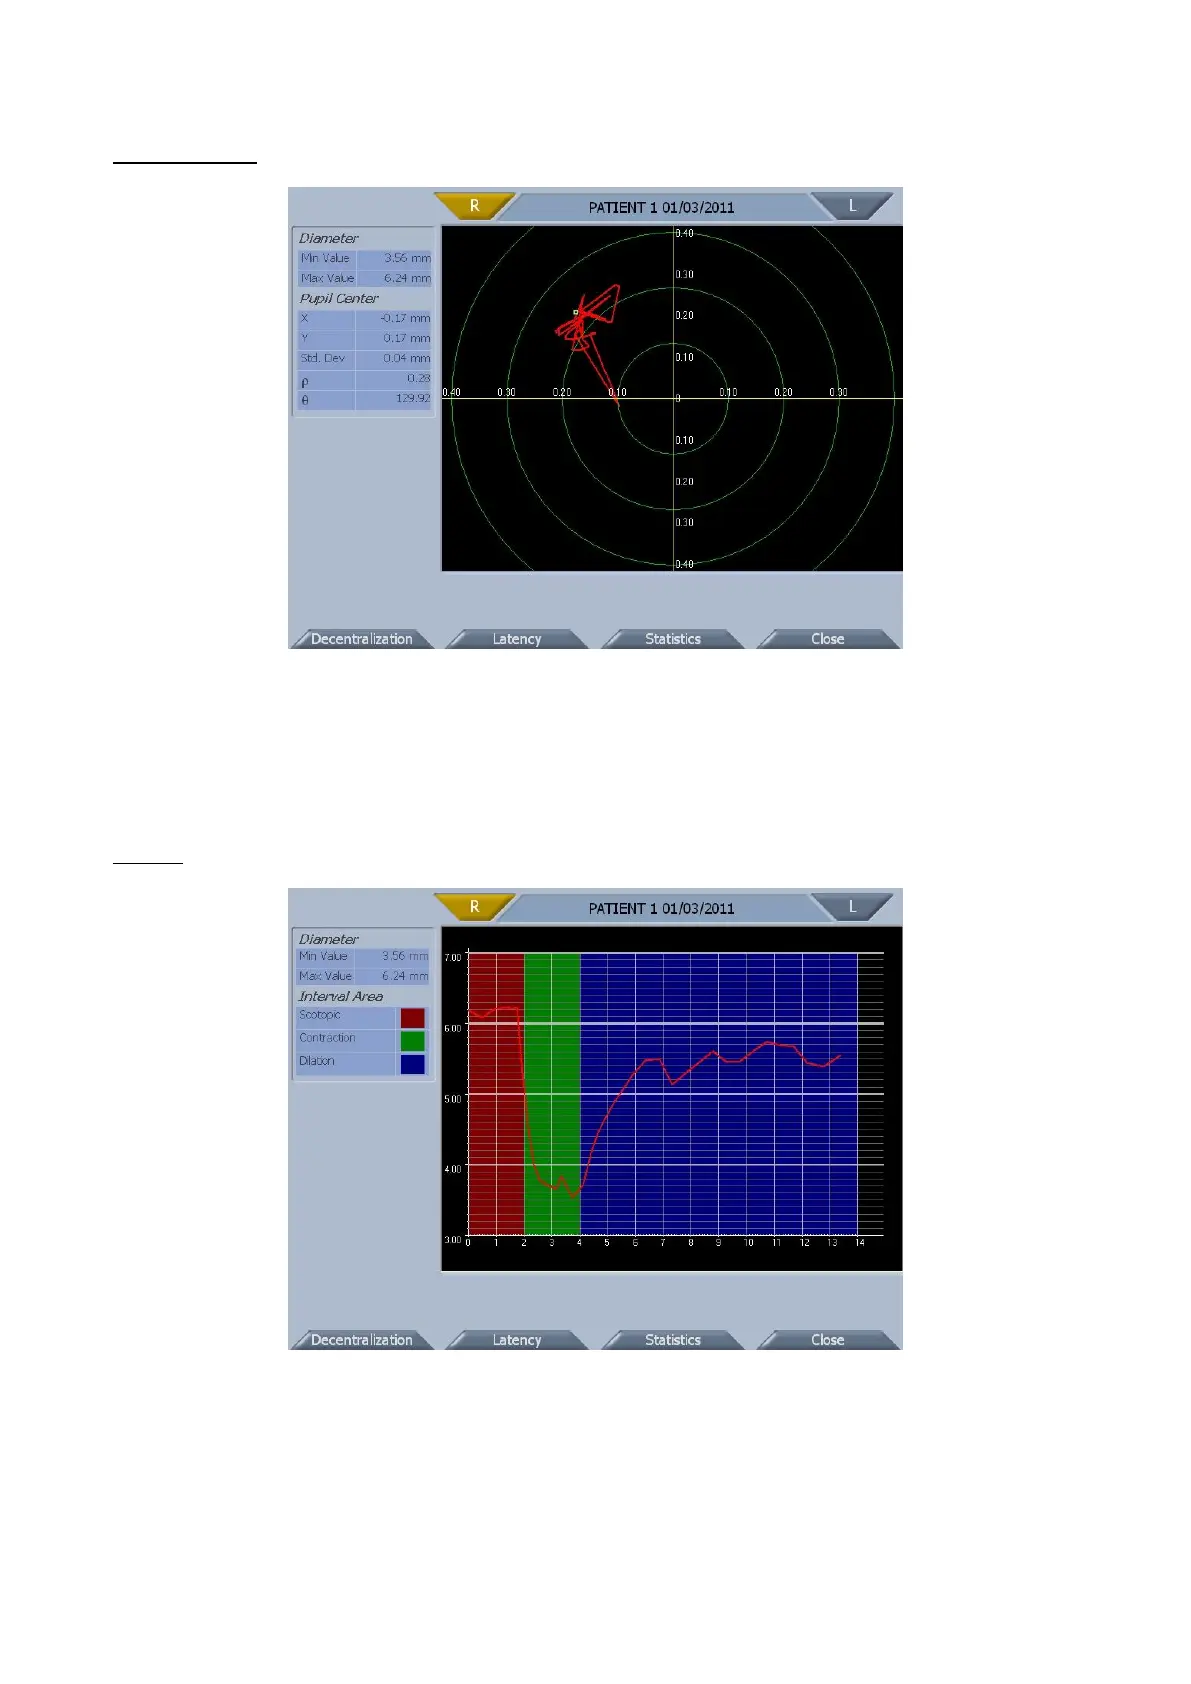
Decentralization
fig. 1-44
The green box identifies the pupil center coordinates with respect to the fixation point. The red lines show
how these coordinates vary during dynamic pupillometry acquisition.
On the left-hand side are the minimum and maximum values of the pupil diameter acquired in dynamic
pupillometry and the pupil center, Cartesian and polar coordinates.
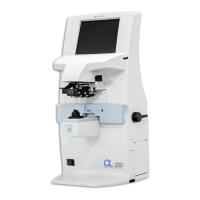
Latency
fig. 1-45
The graph shows the acquisition time in seconds on the X-axis and the pupil diameter in millimeters on the
Y-axis in a normalized scale between the minimum and the maximum values.
The trend of the pupil diameter in the acquisition time is hence represented.
On the left-hand side are the minimum and maximum values of the pupil diameter.