CA-200F Corneal Analyser - Rev. 7 16/01/2012
Photopic, Scotopic, Mesopic
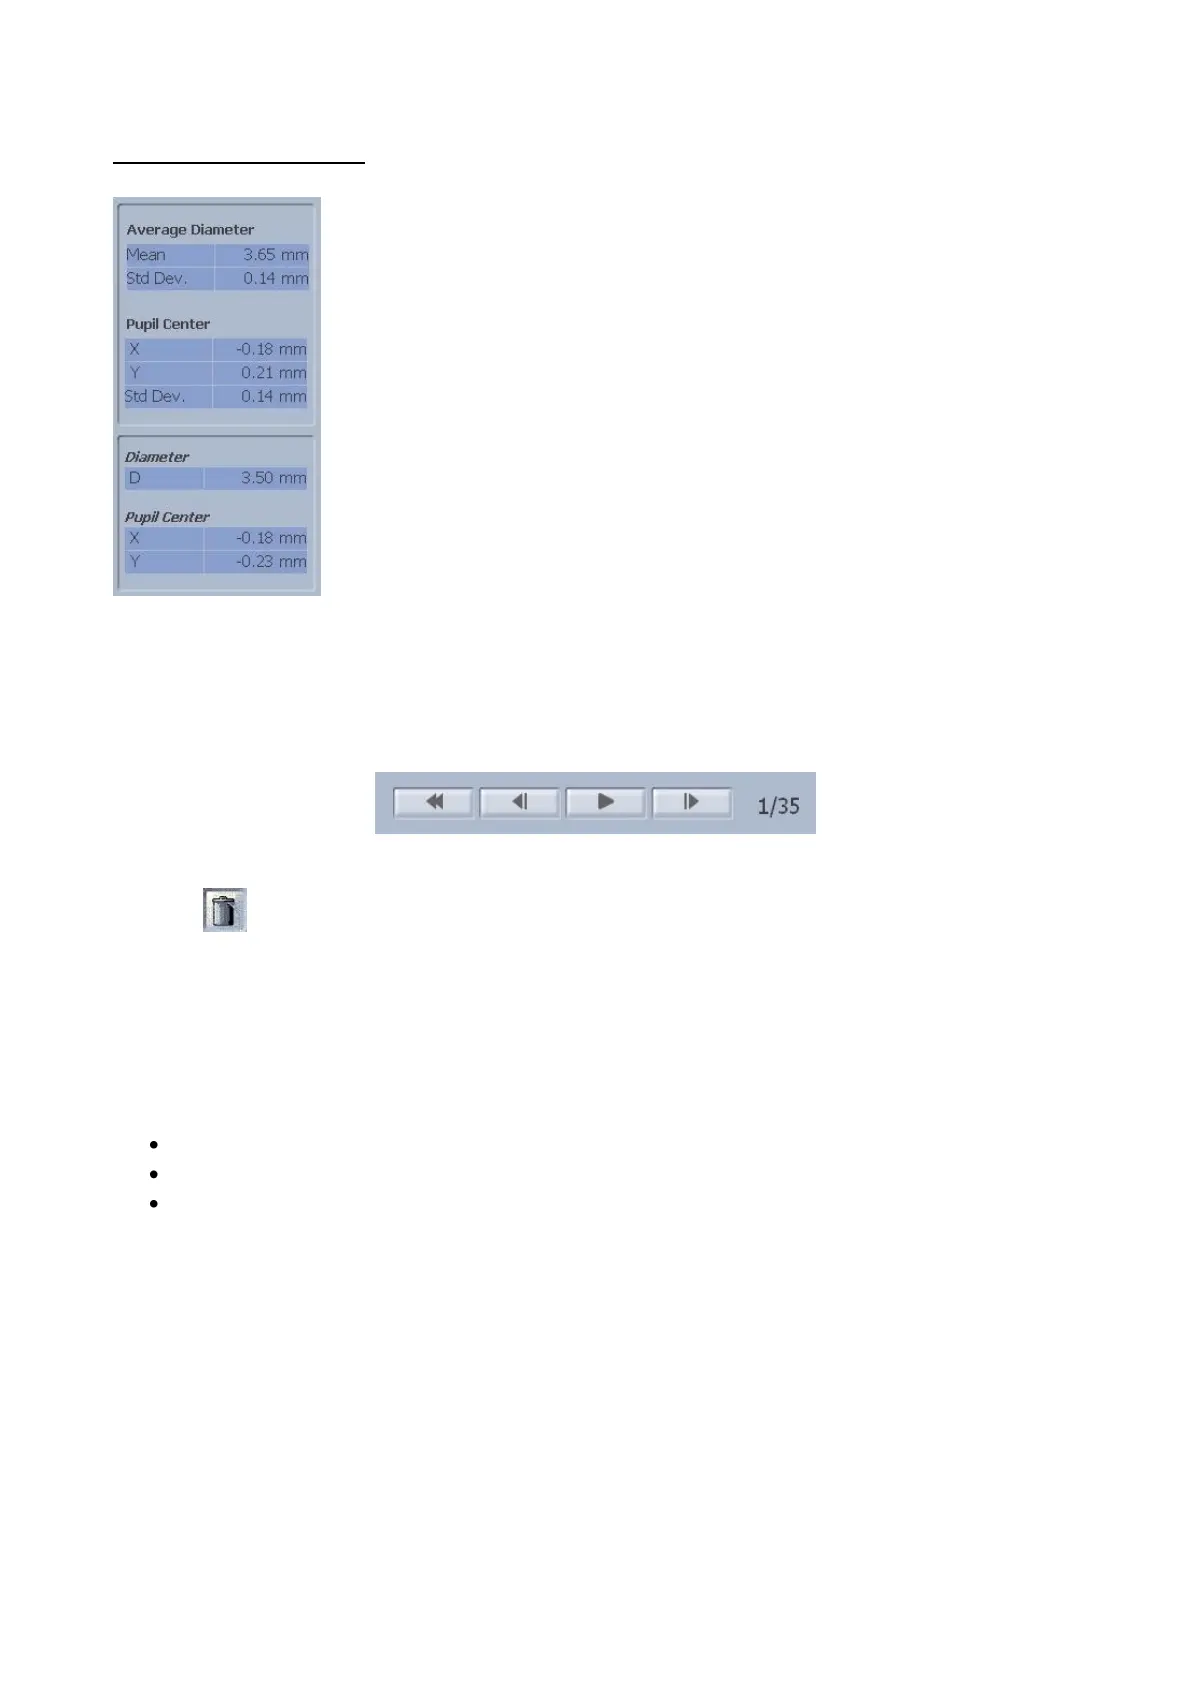
Tap on the “P”,”S”, “M” buttons to view the images of the pupil acquired in
photopic, scotopic and mesopic conditions with the following information (fig.
1-42):
Average value and standard deviation of the average pupil diameter in the
sequence acquired
The other information provided is similar to that described for dynamic
pupillometry.
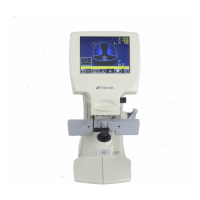
Below the main window there are buttons that allow you to view all the frames in sequence, go forward or
back by one frame or return to the first frame. There are also two numbers that indicate the number of the
image displayed and the total number of images that make up the sequence (fig. 1-43).
fig. 1-43
Press the button to delete individual images from the sequence.
Graphs
Press the "Graphs” button to view the pupillometry graphs:
Decentralization (fig. 1-44)
Latency (fig. 1-45)
Statistics (fig. 1-46)
In the above three cases, tapping on “R” or “L” you can view the graphs of the right or left eye.
The “Close” button closes the graphs.