button to view the detailed traffic statistics of the
port.
5.3.2 Traffic Statistics
Traffic Statistics screen displays the detailed traffic information of each port, which facilitates you to
monitor the traffic and locate faults promptly.
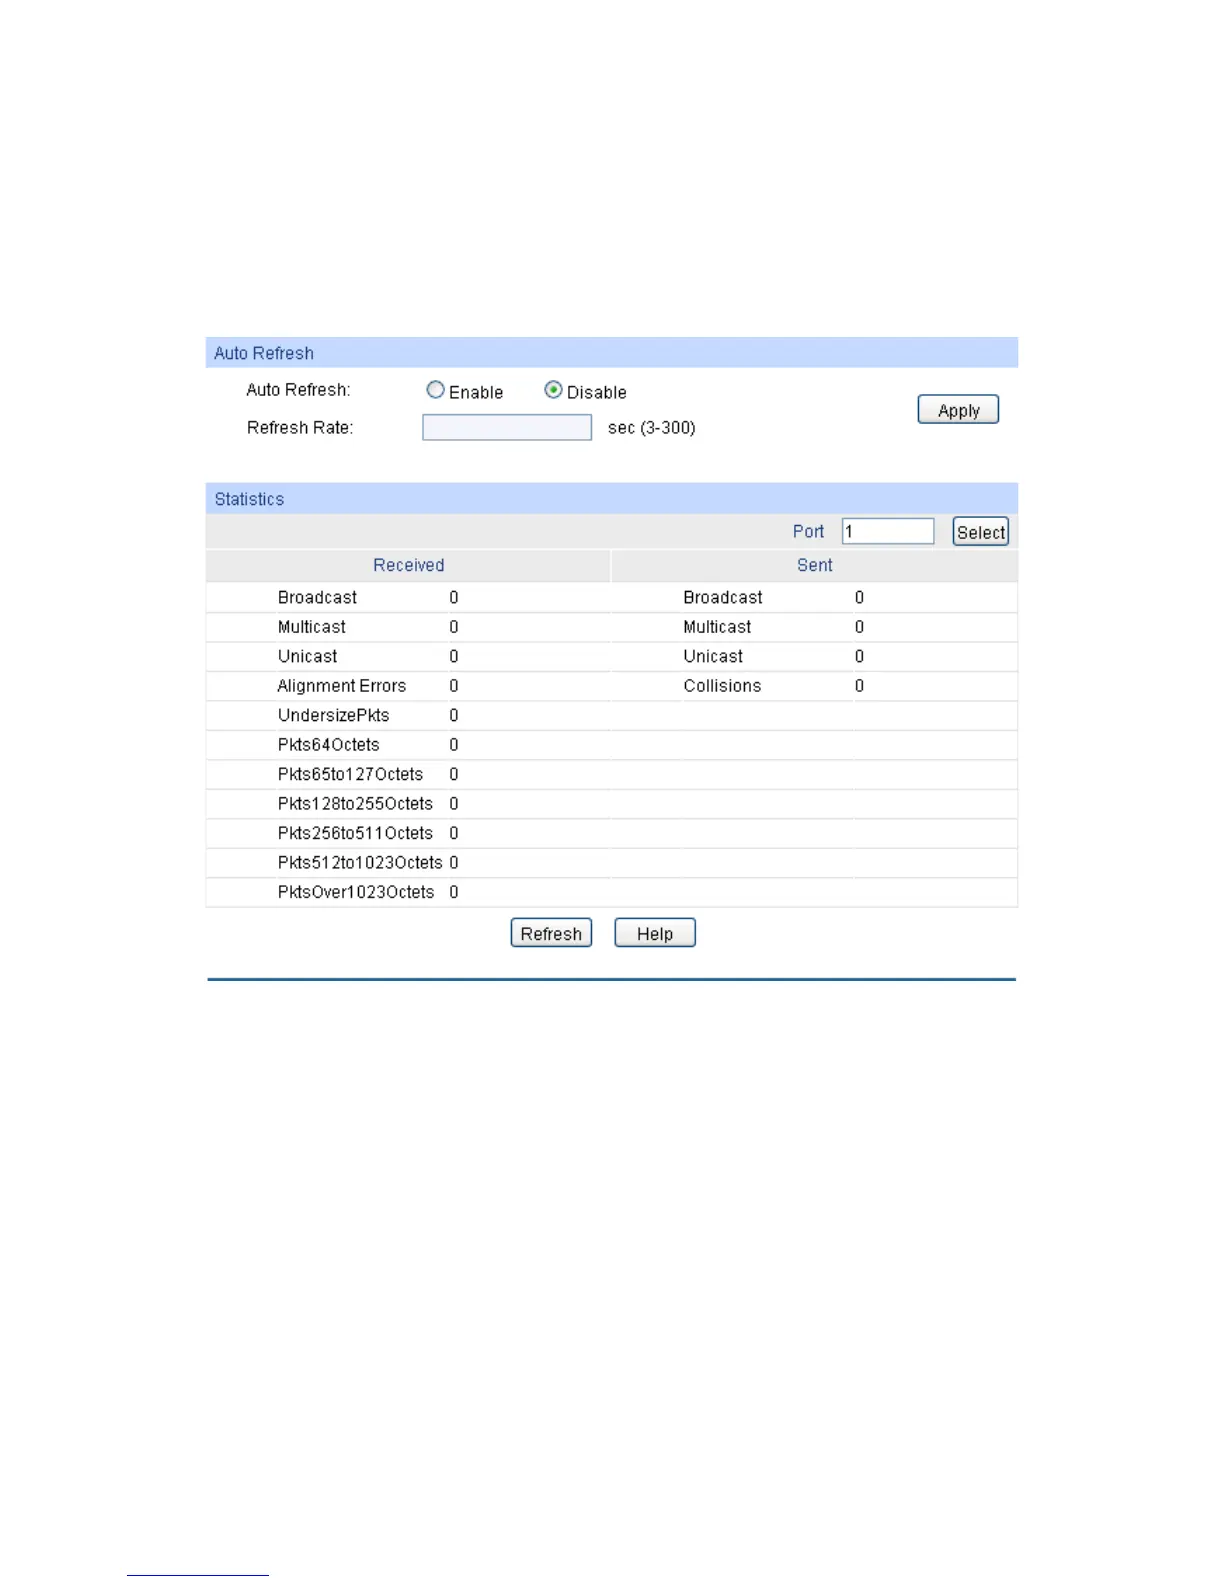
Choose the menu Switching → Traffic Monitor → Traffic Statistics to load the following page.
Figure 5-11 Traffic Statistics
The following entries are displayed on this screen:
: Allows you to Enable/Disable refre
shing the Traffic Summary
: Enter a value in seconds to specify the refresh interval.
: Enter a port number and click the Select
button to view the traffic
statistics of the corresponding port.
: Displays the details of the packets received on the port.
: Displays the details of the packets transmitted on the port.
: Displays the number of good broadcast packets received or
57