AC-SVX003A-EN
81
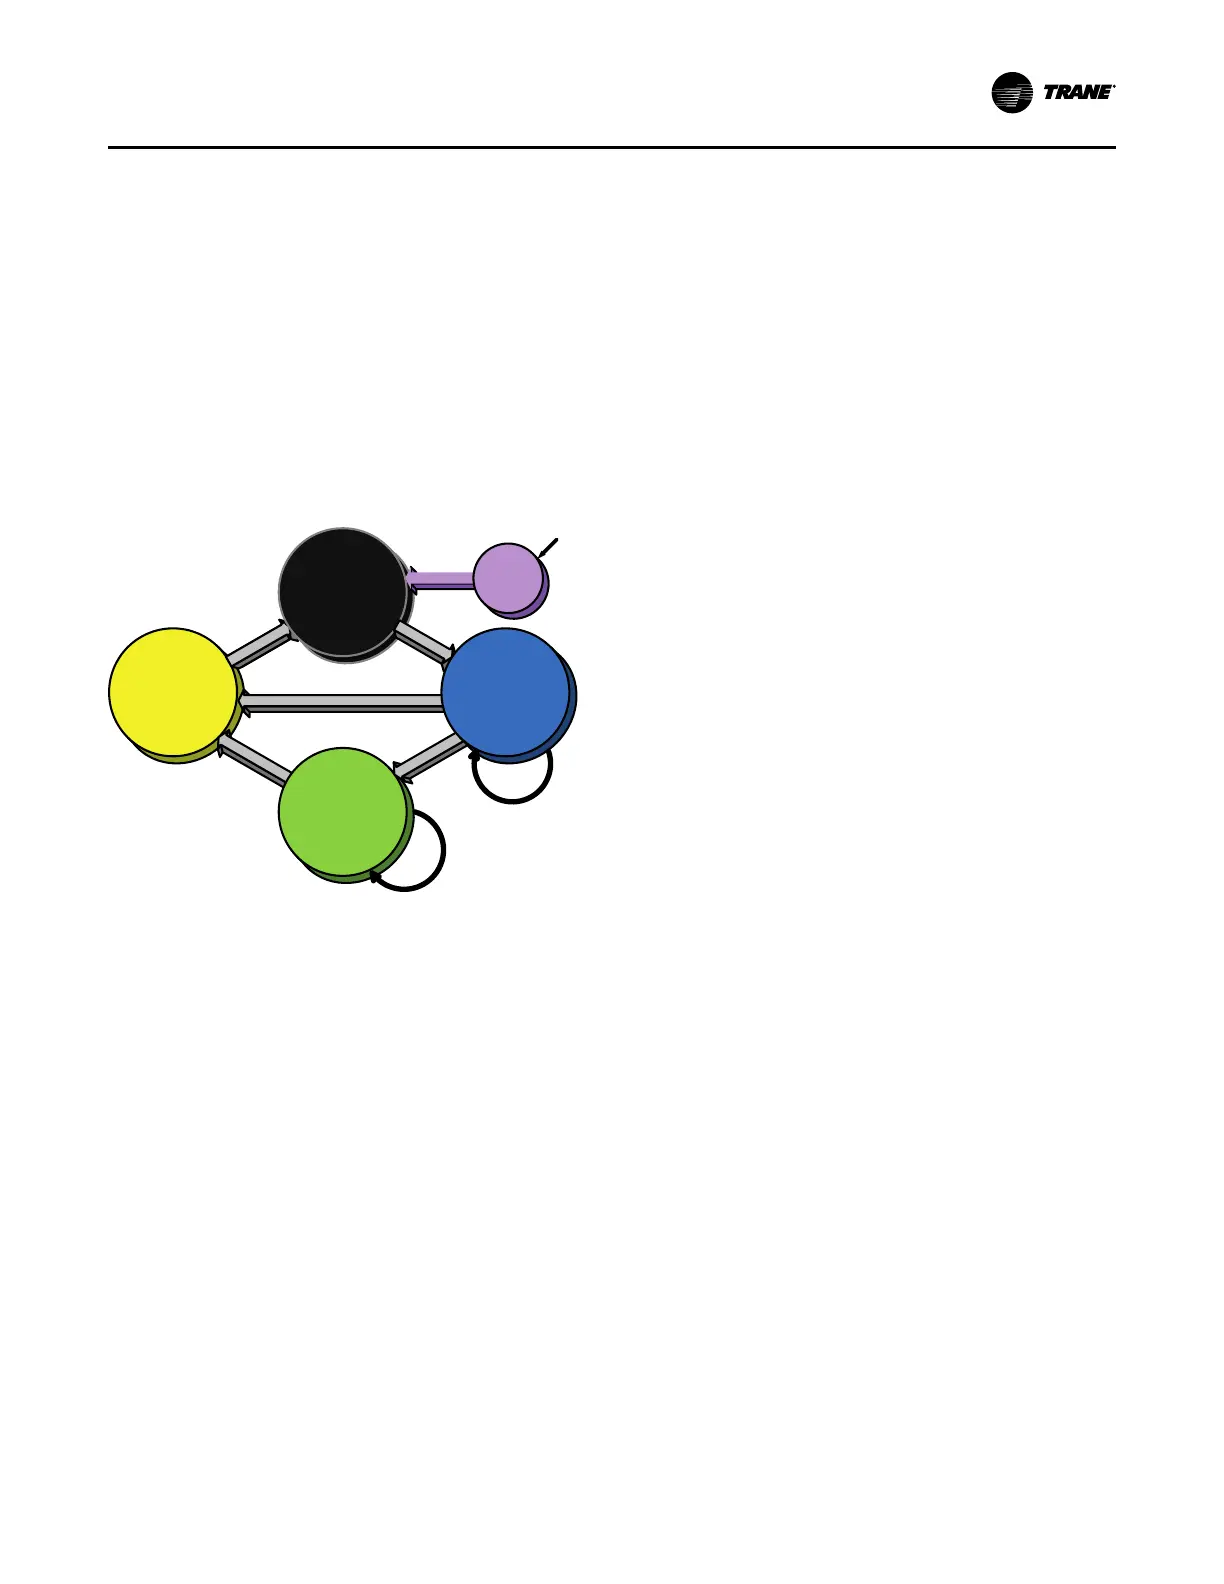
chart, with the arrows and arrow text, depicting the
transitions between states:
• The text in the circles is the internal software
designations for each state.
• The shading of each software state circle corresponds
to the shading on the time lines that show the chiller’s
state.
There are five generic states that the software can be in:
• Power Up
• Stopped
• Starting
• Running
• Stopping
S h u ttin g Do w n
R un ning
or
R un ning Lim it
S to p p e d
or
R un In hibit
A u to
C o m mand
C o n firm e d S tart
S top C o m m
a
n
d
D i
a
gnos
t
ic
C o n firm e d
S h u tdown
B oo t a n d
S e lf T e s t
S top C o m m a n d or D iagnostic
A uto
or
W a iting to Start
Check for
Differential
to Start
Check for
Differential
to Stop
R e lea s e
of Inhib it
P o w e r U p
In the following diagrams:
• The time line indicates the upper level operating mode,
as it would be viewed in the Tracer® AdaptiView™.
• The shading color of the cylinder indicates the software
state.
• Text in parentheses indicates sub-mode text as viewed
in the Tracer® AdaptiView™.
• Text above the time line cylinder is used to illustrate
inputs to the Symbio™ 800. This may include user
input to the Tracer® AdaptiView™ touch screen,
control inputs from sensors, or control inputs from a
generic BAS.
• Boxes indicate control actions such as turning on
relays, or pulsing compressor load or unload solenoids.
• Smaller cylinders under the main cylinder indicate
diagnostic checks.
• Text outside a box or cylinder indicates time-based
functions.
• Solid double arrows indicate fixed timers.
• Dashed double arrows indicate variable timers.
Start-up and Shutdown
 Loading...