28 BAS-SVX50F-EN
Reports
Observe the following best practices:
• Use a program such as Microsoft Paint to save graphics using the following recommended
formats: png, jpg, or gif. File formats such as bitmap (bmp) result in much larger files sizes.
• Open the image using Microsoft Pain
t (or
similar program), and resize the image to smaller
dimensions.
• If the image file was created by Centralized Graphics or an
other graphics specialist, request a
new image with a file size under 2 MB.
Note: Ver
ify that the image quality is acceptable afte
r saving in one of the recommended
formats. JPG and GIF file formats use image compression which can reduce the quality
of the image.
Custom Reports
You can create up to three custom reports using the Tracer TD7 Display or the Tracer TU service
tool. Reports may contain all nine point types. A maximum of 36 pieces of data is allowed per
custom report. Available reports are labeled Custom Report 1, 2, or 3.
Creating a Custom Report
1. Navigate to the Reports screen, then touch one of the three custom report buttons.
The Custom Report (1, 2, or 3) screen appears.
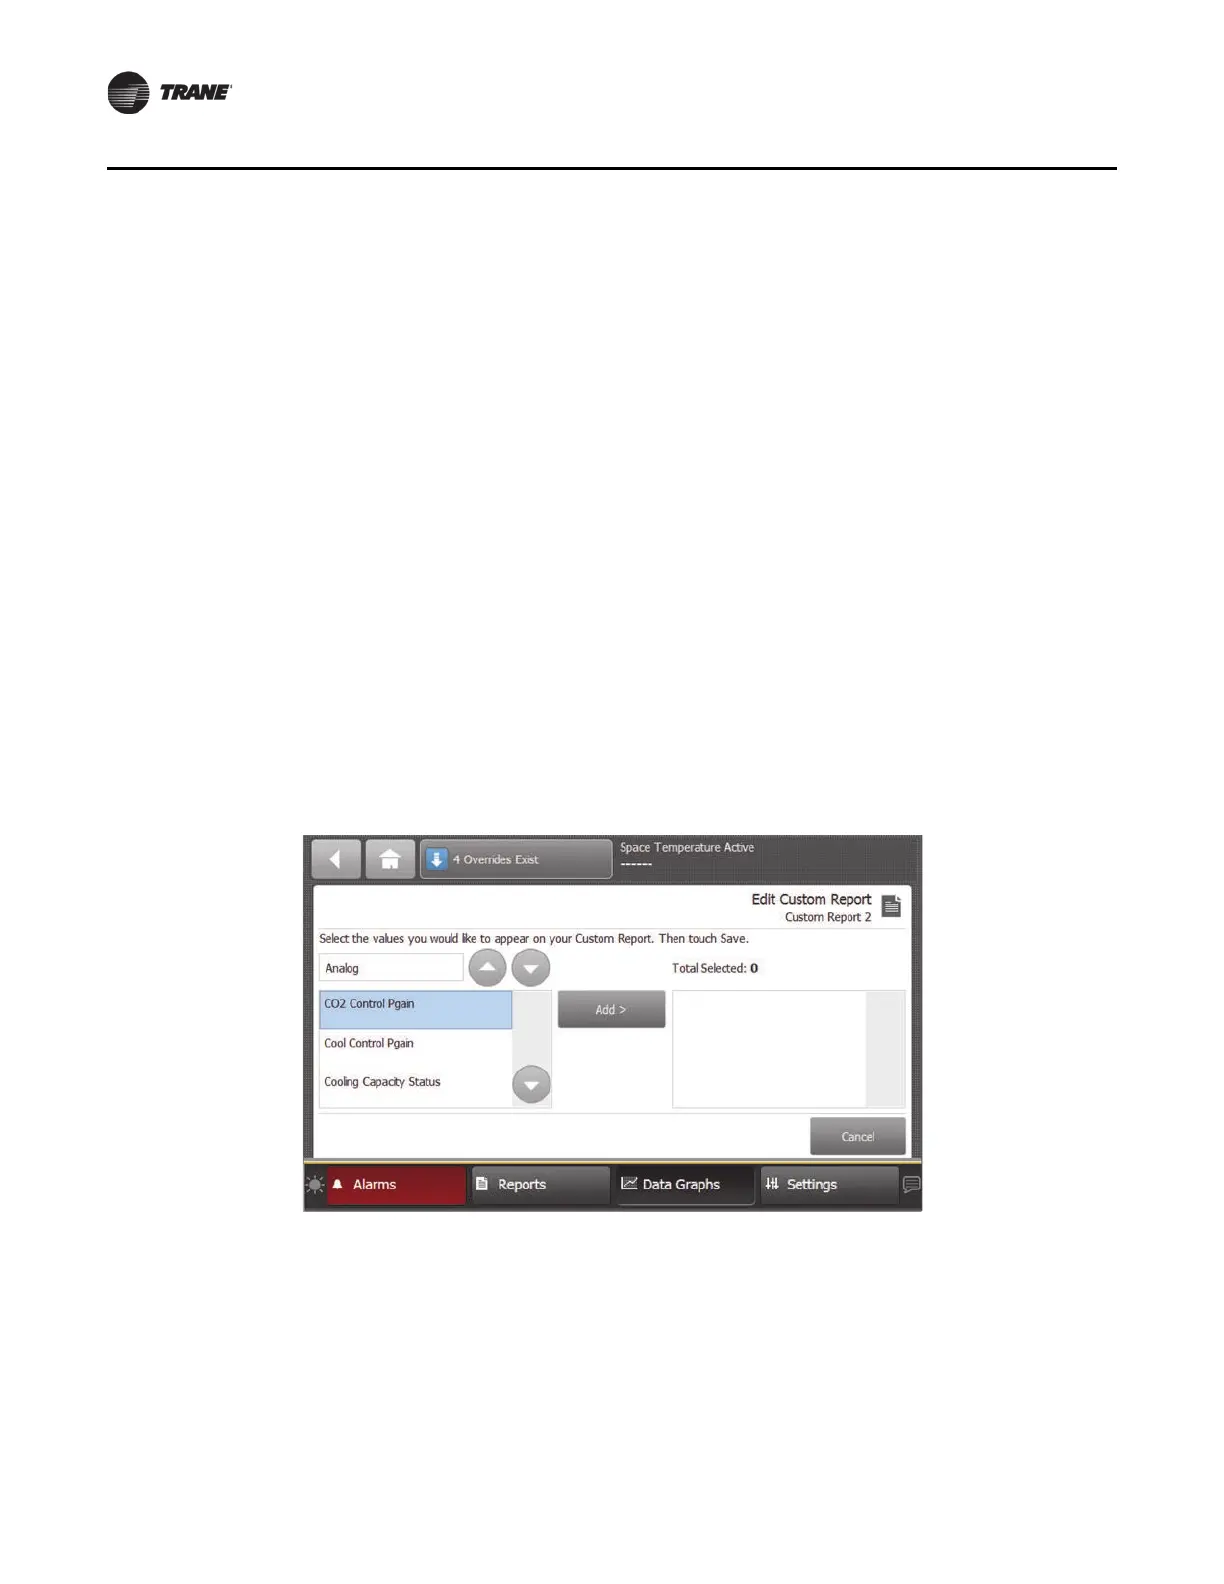
2. To
uch the Edit button.
The Edit Custom Report screen appears (Figure
15).
Figure 15. Creating a custom report
3. Use the up and down arrow buttons to
sele
ct a point type. Add items by touching the item that
is highlighted blue, then touch the Add button.
4. Continue adding values to your report. When you are f
inished, touch the Save button.
The Custom Report screen, populated with your selected values, appears (Figure 16).
To view the items in the selected
list,
touch a value in this list and use the up and down arrows
to the right of the list. To change the location of an item in the list, select the item and then use
the up and down arrows above the table to move the items.
Note: Changes to the
report name must be done in Tracer TU.
 Loading...