2: Setup and Operation 19
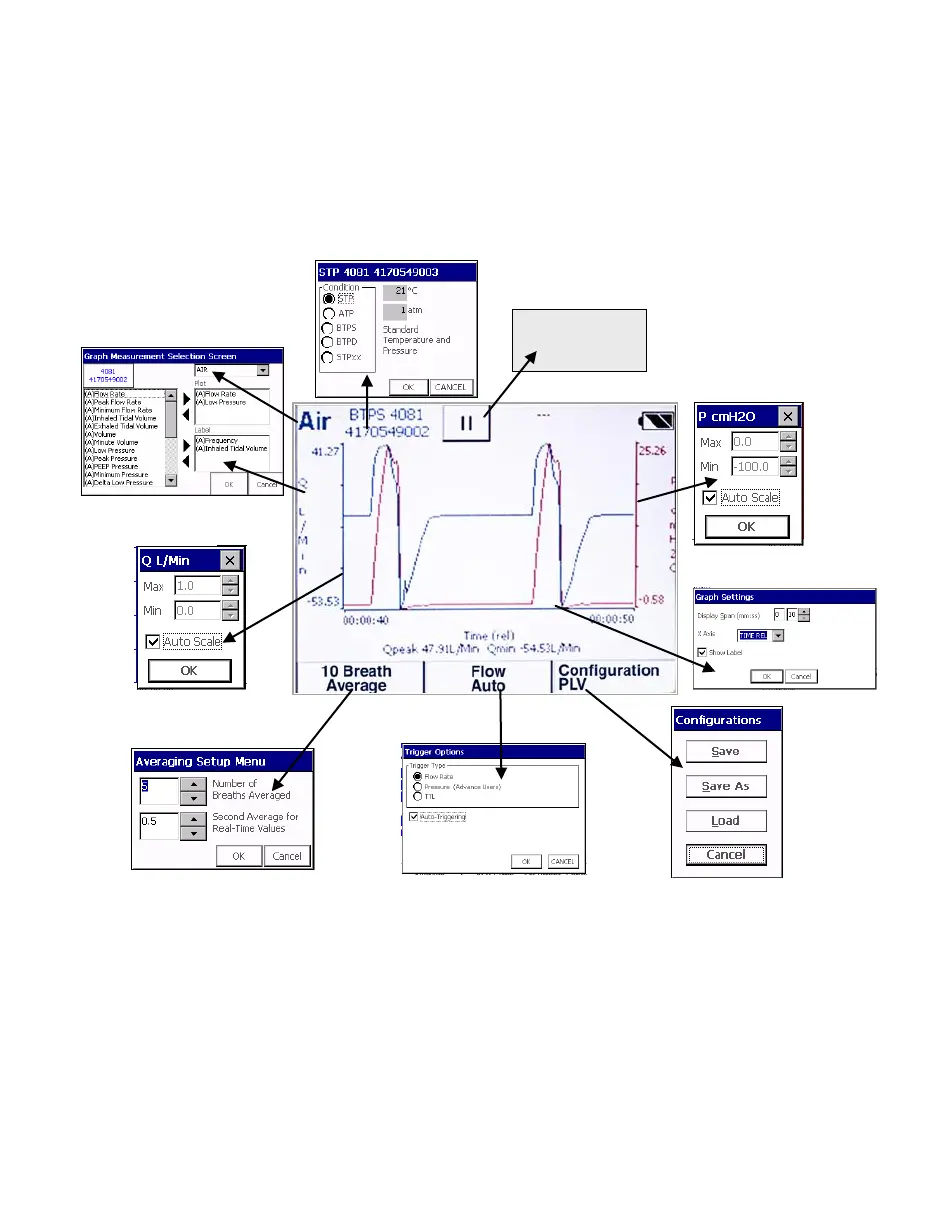
By touching on the active areas of the Graph Screen, you can change the
configuration of the display by choosing which parameters to plot on the Graph,
units of measure, gas calibration, gas conditions, averaging, triggering, x and y axis
scale. You can also save the display configuration to a file or load a previously
saved configuration.
Figure 18. Graph Screen Features