Chapter 5: Monitoring the Patient
Veterinary Vital Signs Monitor Operation Manual
5-7
The information in the trend table is displayed as a list. The available number
and categories of parameters are the same as with the trend graph. In the
trend table, the median time is the cursor time value in the trend graph. The
value of each parameter is date and time (except NIBP). The NIBP value is the
first value in the current interval.
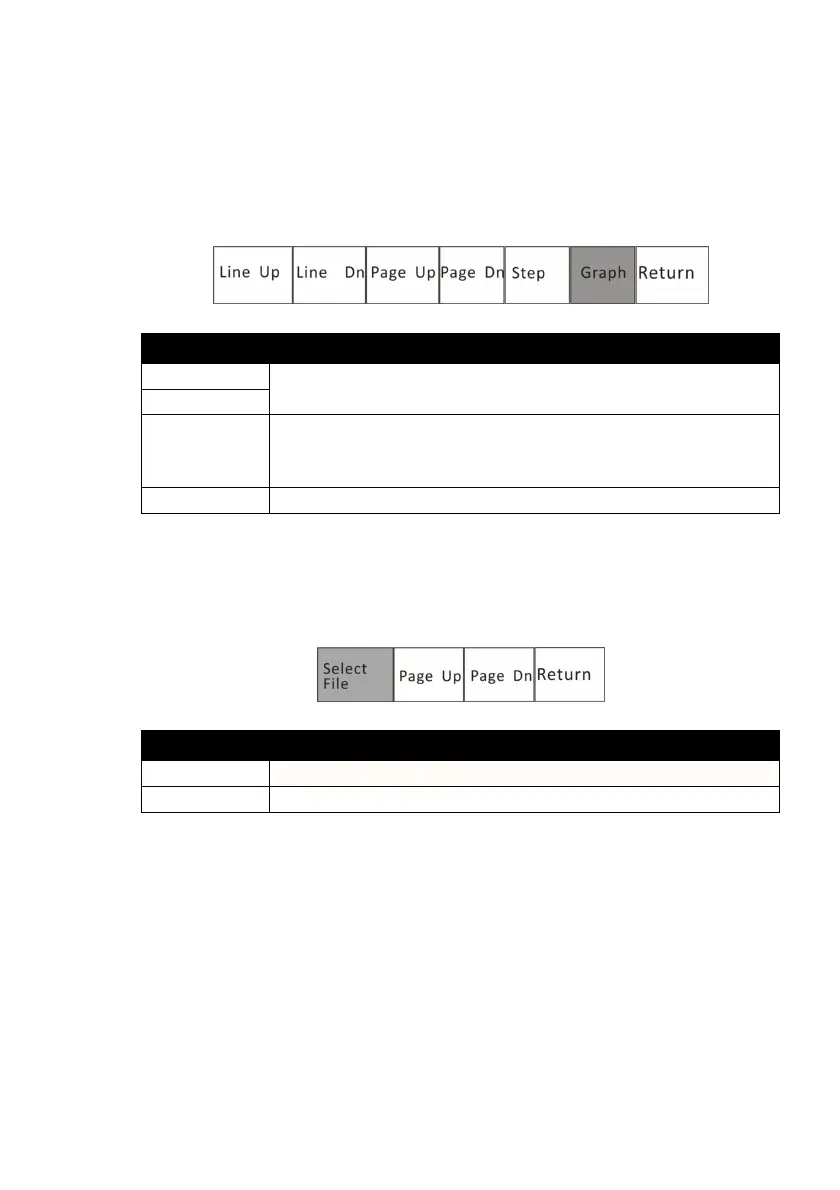
ITEMS INSTRUCTION
Line Up/Dn
Browse the time frame.
Page Up/ Dn
Step
The trend table’s data compress or append according to
step. The available steps are 1 minute, 5 minutes, 10
minutes, 20 minutes, 30 minutes and 1 hour.
Graph
Select this option to back to the trend graph display.
3. Review Freeze Wave
In the review submenu, highlight the “Wave” and push the rotary knob to
select. The following menu will be displayed:
ITEMS INSTRUCTION
Select File
Select a saved file to review.
Page up/ Dn
Browse frozen waveform page by page.
4. Review Alarms
The user can review 1000 alarm records.
In the review submenu, highlight the “Alarm” and push the rotary knob to
select. The monitor will display the stored alarms for all the parameters.