Manual for VAKI Micro/Macro
Visibility Examples
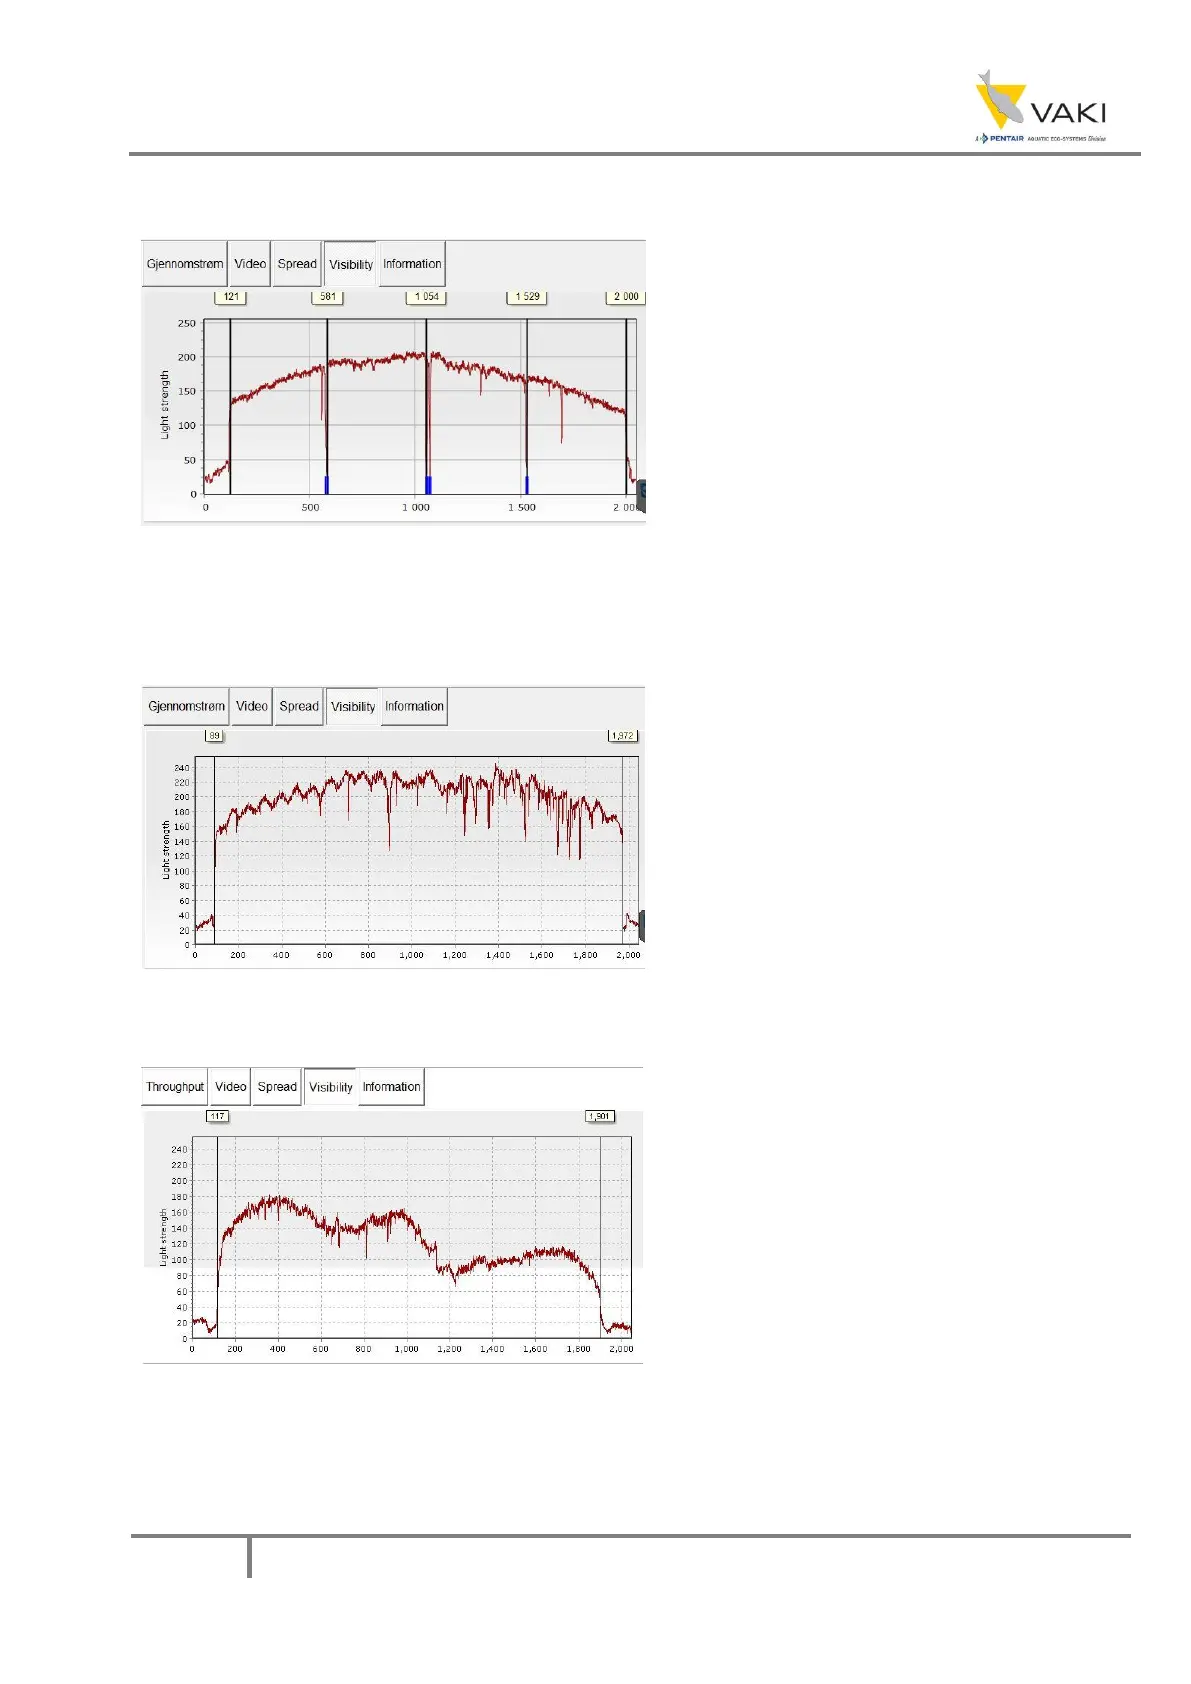
Figure 19 - Visibility Example 1
The diagram on the left shows how the graph
can look if there are any impurities on the
glass / mirror, and the brightness is somewhat
low. It is reasonable to assume that there are
impurities on glass over light, possibly on
mirrors, at the x-axis value about 550, 1100
and 1700, represented by thin falls in the
brightness graph. In this case, it would be
good to clean the glass and mirrors, and
calibrate the counter.
Figure 20 - Visibility Example 2
This diagram also shows dirt or other
impurities on the glass or the mirror. The
waves in the curve also indicate that the bulb
has not reached full operating temperature.
Figure 21 - Visibility Example 3
Here, the light curve is also changed due to
impurities on glass and mirrors. In this case, it
is possible that a calibration cannot be carried
out, and thus washing must be carried out
before counting. In this case, the camera may
also be misaligned.