LabQuest
®
App
22
Data Analysis
You can analyze data from the Graph screen or the Table screen .
Examining Data on the Graph Screen
To examine data on the Graph screen, tap on a data point of interest. The Examine cursor jumps
to the data point with the nearest x-value. Cursor lines highlight the x- and y-axis values, and the
right-side readouts display the associated numerical values of the examined point. You can make
fine adjustments to the cursor location by using the Left Examine Button and Right
Examine Button located on either side of the horizontal-axis label.
In some cases, you may want to examine data for a particular region on the graph. To select a
portion for analysis, tap-and-drag across the desired region. You can adjust the trailing endpoint
of the selected region using the Examine Buttons, if needed. For greater control, you can opt to
use the stylus.
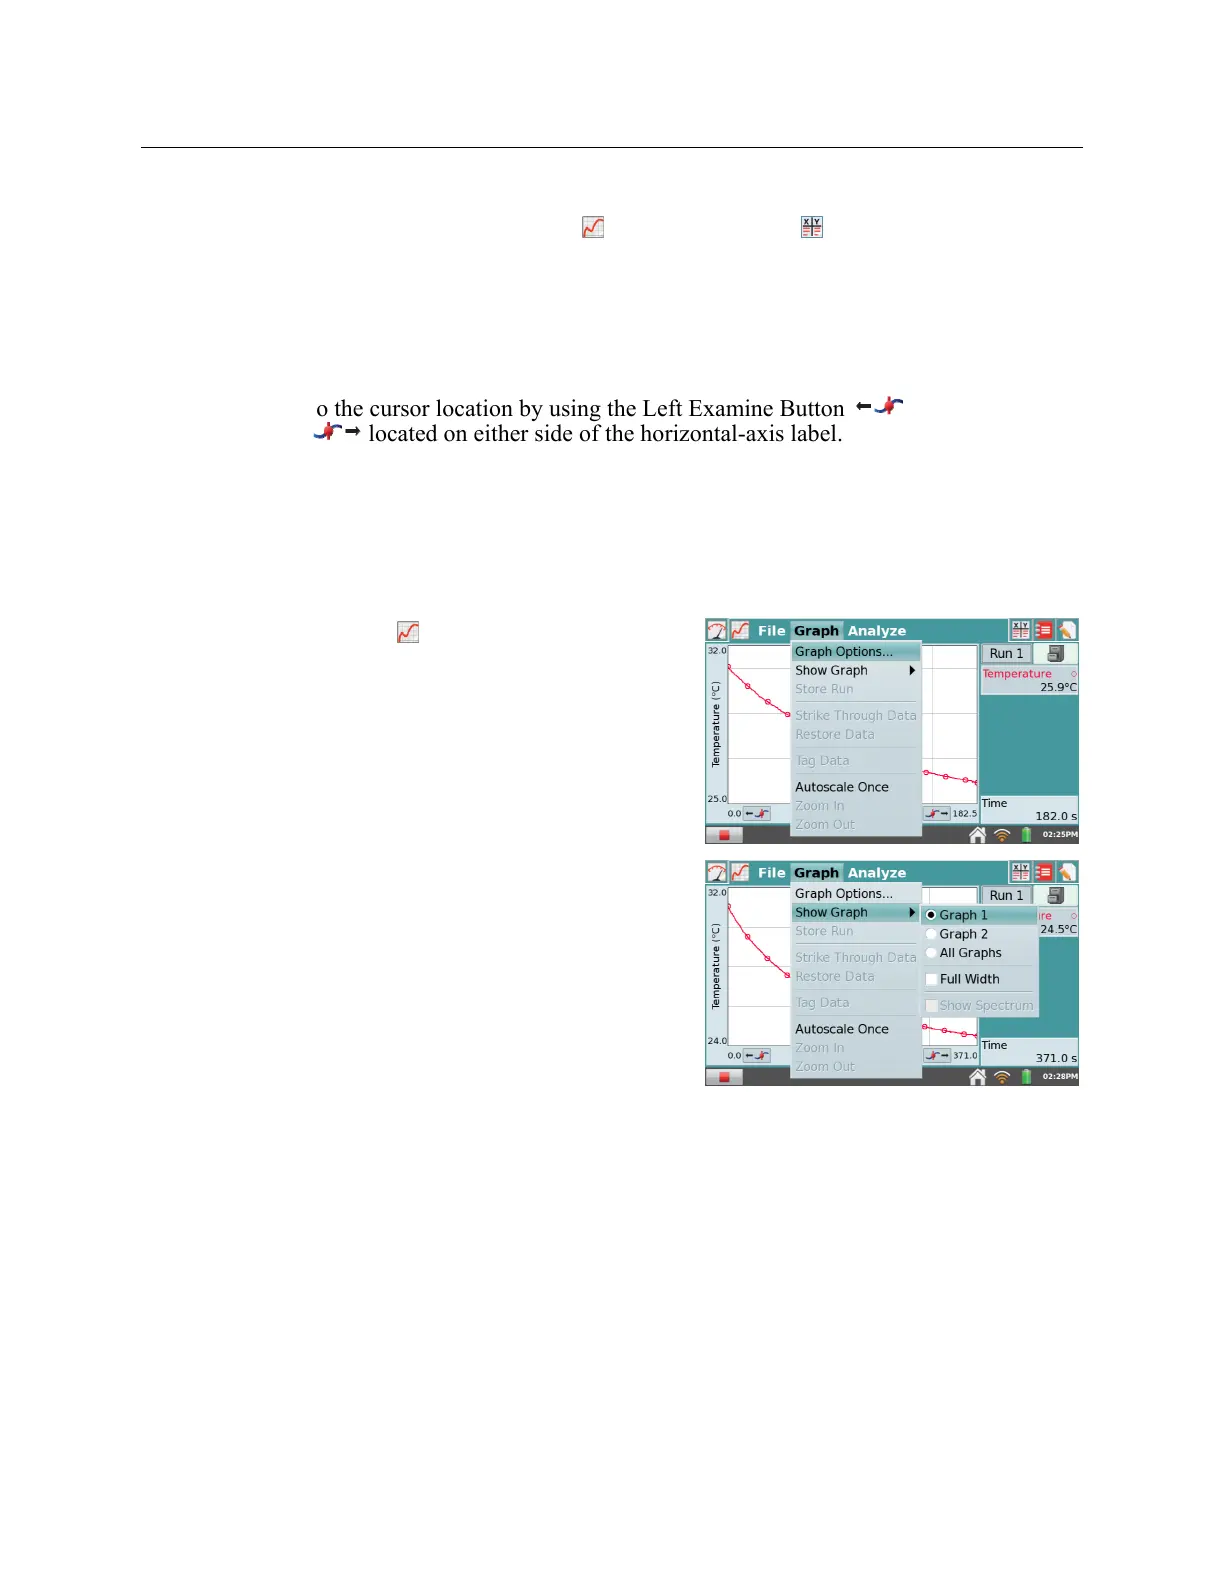
Adjusting the Graph View
You can adjust the graph view in real time during data
collection by applying one of the following actions
from the Graph menu.
Graph Options
– Tap Graph Options to manually
adjust graph settings. To adjust the graph view,
change the values in the Left and Right fields for
the x-axis and y-axis.
Show Graph
– Choose Show Graph from the Graph
menu to quickly jump between displaying one or
two graphs. You can also choose the Full Width
option to remove the data-collection summary box
and maximize the graphs on the screen.
When using spectrometers to collect full spectrum
data, the spectrum is displayed on the graph
background by default. Accordingly, Show
Spectrum is selected under the Show Graph
options. To hide the spectrum, tap on Show
Spectrum to deselect that option.
Autoscale Once
– Choose Autoscale Once from the Graph menu to scale the graph tothe
ata
you have collected so far.
TIP! The graph will automatically rescale larger to show data collected that would
otherwise be off the graph.
Tap on a graph axis label to change the data that are plotted on that axis.