LabQuest
®
2 – User Manual
27
Draw Prediction
– The Draw Prediction tool is a
free-hand sketch tool for drawing on the Graph
screen. This can be used for a variety of purposes,
but is most often used to sketch a prediction of how
a graph will appear once data are subsequently
collected.
Choose Draw Prediction from the Analyze menu.
Then, tap-and-drag across the screen for smooth
curves, or tap the screen to connect subsequent taps
with straight-line segments. The Reset button
removes your sketch if you need to start over. Tap
OK to place your sketch on the main graph. To
remove a prediction, choose Draw Prediction again
from the Analyze menu.
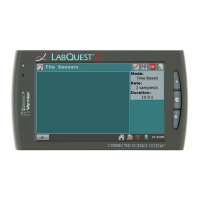
Motion Match
– The Motion Match menu item is
only available if a Motion Detector is connected.
Choose between a new Position or Velocity match.
In each case, LabQuest generates a random target
graph for the matching exercise. Only the selected
graph, Position or Velocity, is shown. You may
collect data over the target graph as many times as
you like using the Collect button. To see a new
target graph, choose New Position Match or New
Velocity Match. Remove Match removes the target
graph.
TIP! For additional information on using Motion Detectors, see www.vernier.com/til/5.
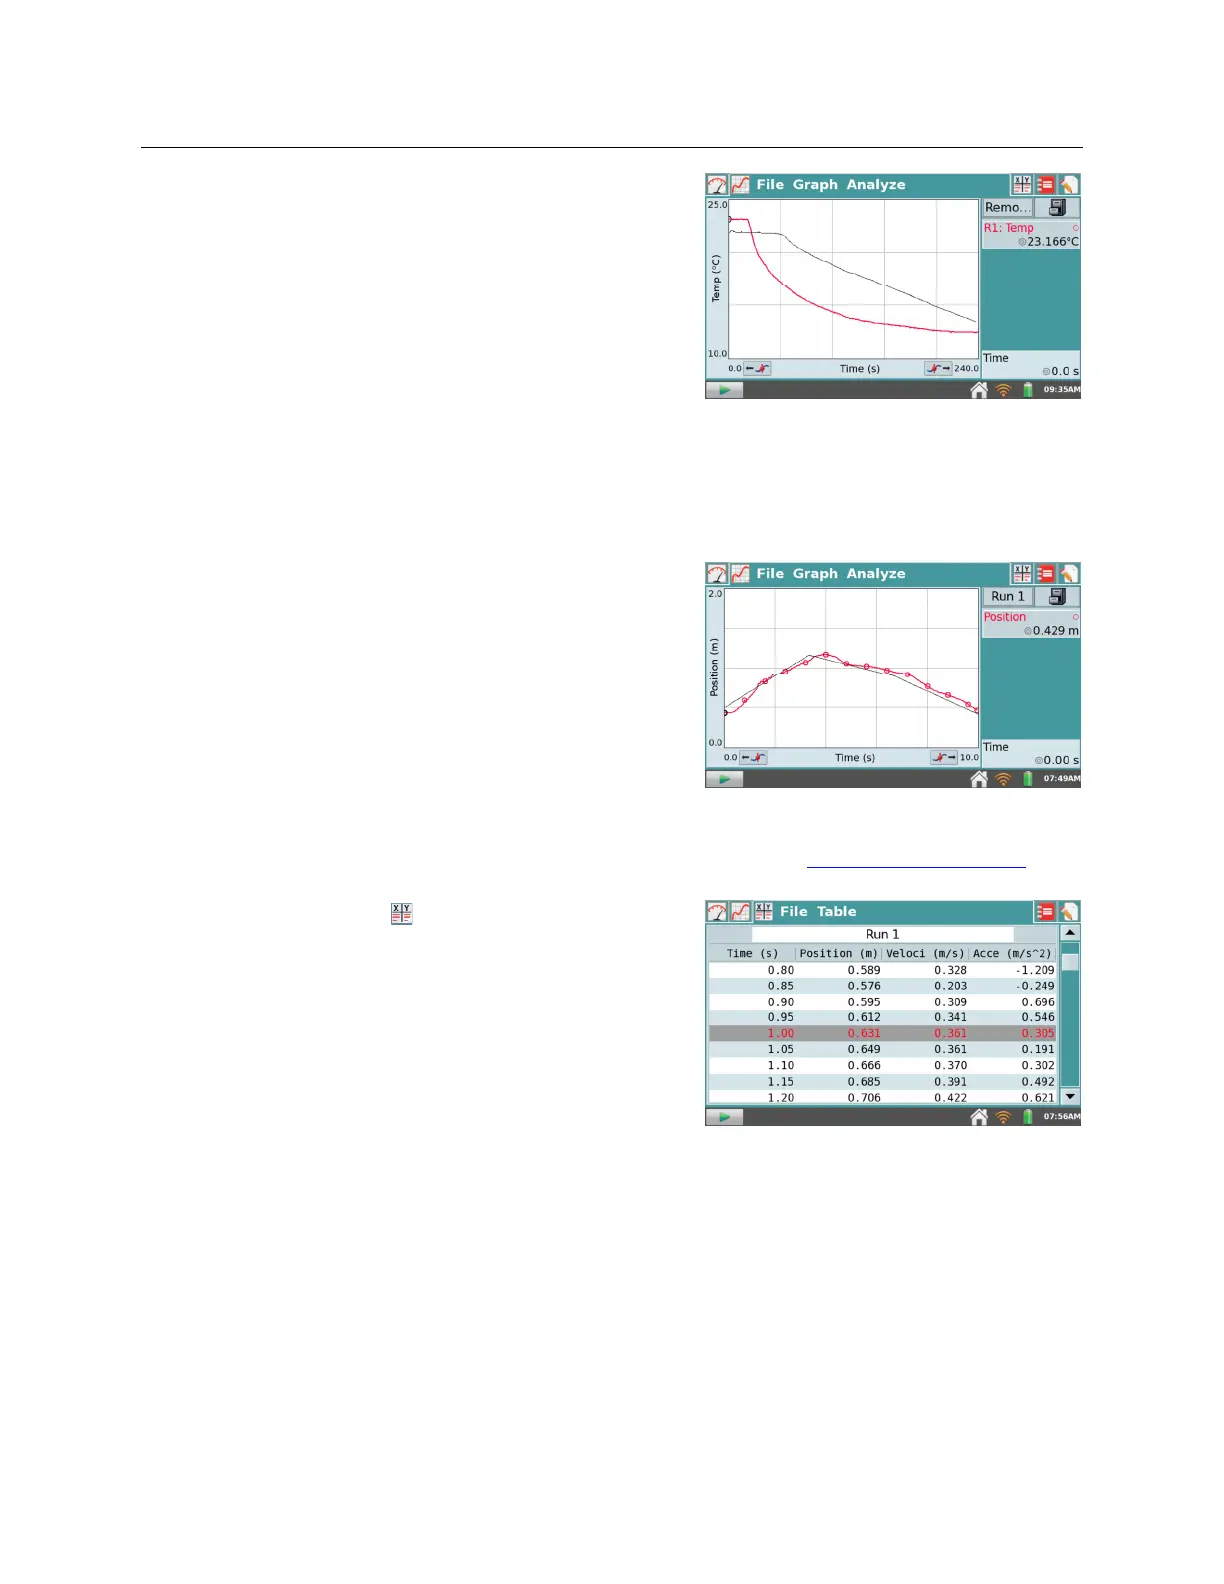
Adjusting the Table View
In addition to viewing and manipulating data from the
Graph screen, you can also access data from the Table
screen. There are several shortcuts on this screen.
Alternatively, you can also access the fields by
choosing Data Column Options from the Table menu.
Tap Run 1 in the name field to rename the run.
Tap a column header (Time, Position, etc.) to
change the column name, units, or displayed
precision.