Chapter 3 Web Interface of RDU501
RDU501 Intelligent Monitoring Unit User Manual
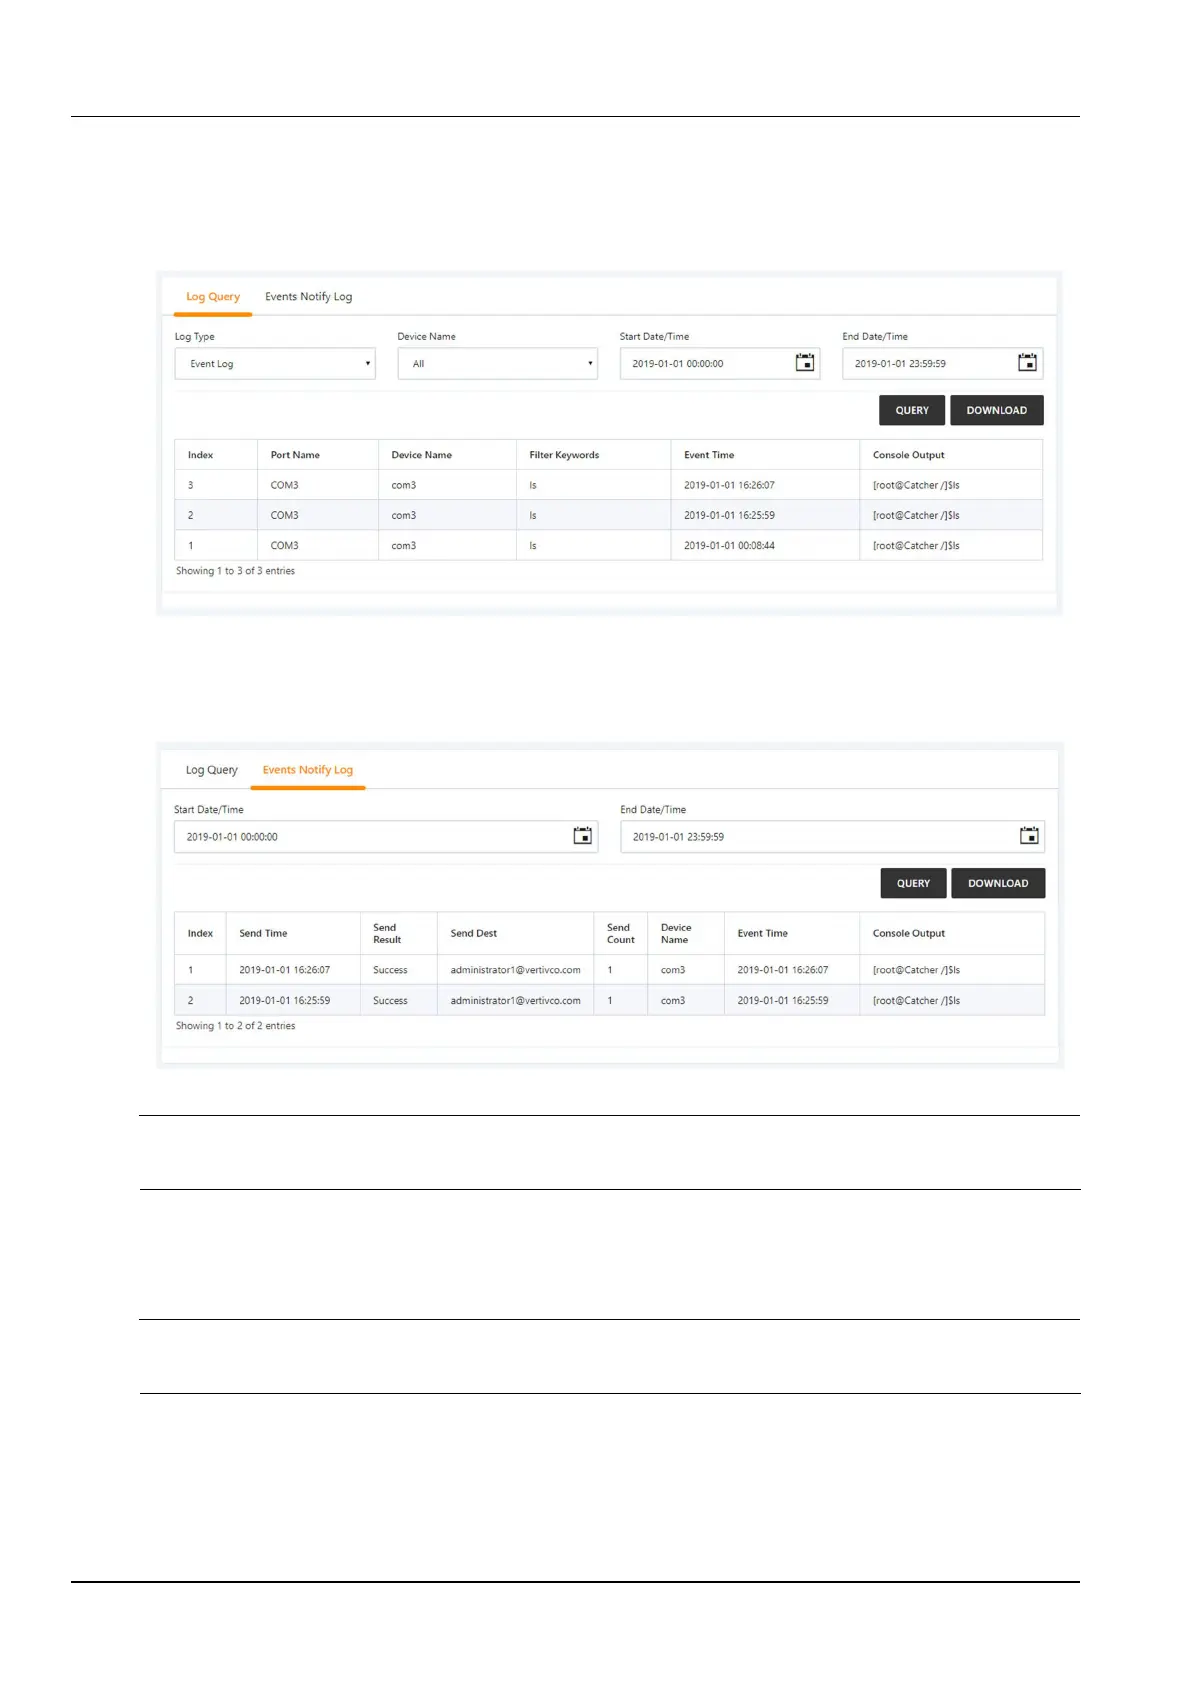
Click the Console Log Data submenu under the IT Management menu. The console log data page contains two
tabs, the log query and the event notification log, as shown in Figure 3-51.
Select the query type, device name, start time, and deadline. Click the Query button to query the event log that
meets the filter criteria. Click the Download Query Results button to download the corresponding event log list. The
historical log can only be viewed after downloading, and cannot be directly queried.
Figure 3-51 Console log query
Click the Event Notification Log tab to display the page shown in Figure 3-52. Select the start time and the end
time, click the Query button to query the event notification log within the selected time period. Click the Download
Query Results button to download a log that matches the filter criteria.
Figure 3-52 Console event notification log
Note
The log query page and event notification log page display up to 500 query results. If there are more than 500 PCS, you need to
download through “Download query results” to download all query results.
Server shutdown management
This function controls the IT server switch with the power and environment monitoring device signal or time schedule
as input.
Note
In the RDU501 standard product, this module only provides relatively basic functions. If you have more functional requirements,
please contact us.
Click the Server Shutdown Management submenu under the IT Management menu to open the Server Shutdown
Management page and display the strategy list, as shown in Figure 3-53.