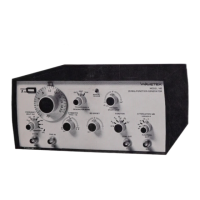
Model
2001
MAINTENANCE
5.3
PERFORMANCE CHECKS
The following procedure is intended to ensure that the in-
strument meets its published specifications. The checks
specified assume that the instrument is equipped with A-2
optionsat 1 MHz, 10 MHz, and 50 MHz. While
it
is possible
to check the instrument's performance without the use of
harmonic markers, by using suitable external CW sources, a
complete check by this method
is
impractical.
5.3.1 PRELIMINARY CHECK
Rotate both START and STOP thumb wheels to their low-
est frequency position (turn full left). Both frequency
indicators must read
0 MHz, k2MHz, when read on the
SWEEP WIDTH frequency scale. (Interpolation on the
Sweep Width scale between
0 and 10 MHz is necessary to
locate
+2 MHz).
Preset controls as follows: BAND to 1, SWEEP TIME to
LINE, OUTPUT to
+10dBm, MARKER WIDTH to WIDE,
MODE to CW, the four paddle switches to their extreme
down position, 50 MHz HAR markers to on (in position)
and the remaining markers and MOD off. Set the CENT
FREQ to 250 MHz (left thumb wheel) and connect the
power meter to the RF out connector. (Ensure the power
meter is on the
+10dBm scale).
for 5 minutes. The power meter must read between
+9.5
to +10.5dBm. The calibrating procedure calls for +10dBm
adjustment at 300 MHz. However, some error must be
allowed for changes due to ambient operating temperature
and variations between power meters.
5.3.2 FREQUENCY CHECKS
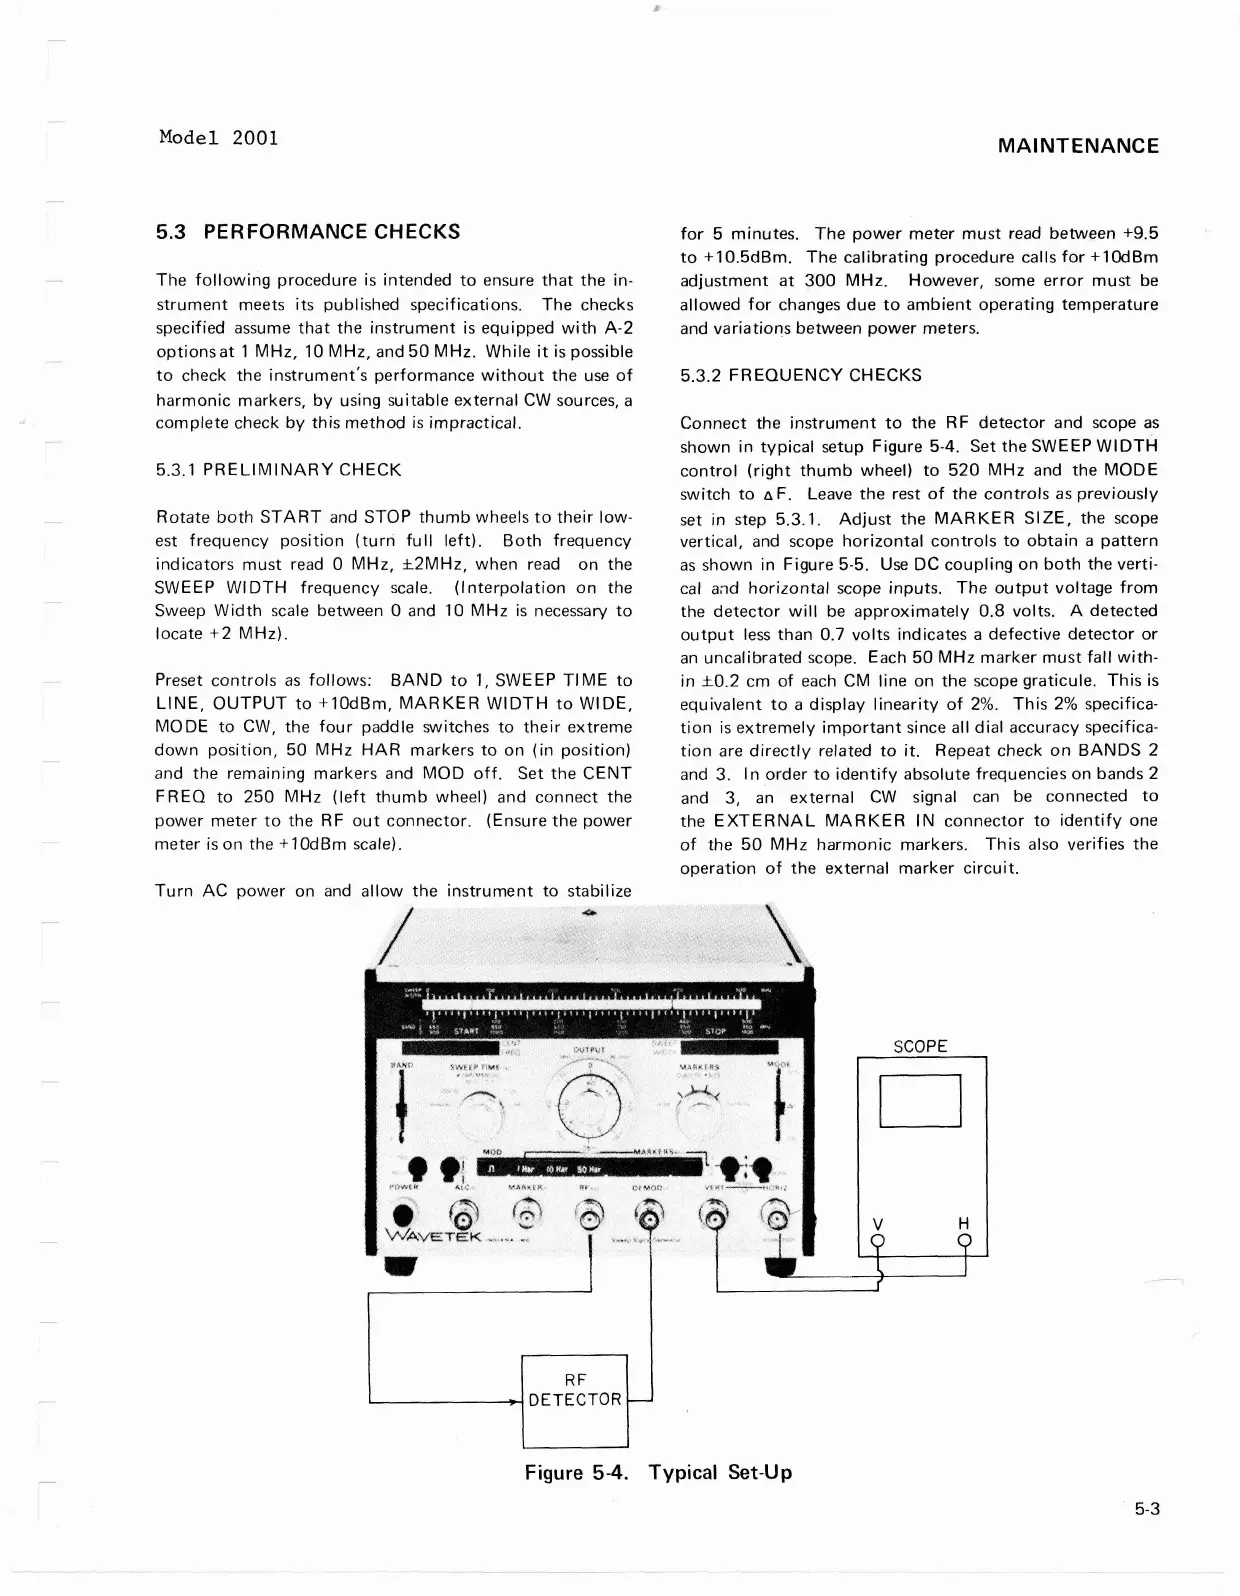
Connect the instrument to the RF detector and scope as
shown in typical setup Figure
5-4.
Set the SWEEP WIDTH
control (right thumb wheel) to 520 MHz and the MODE
switch to
nF. Leave the rest of the controls as previously
set in step
5.3.1. Adjust the MARKER SIZE, the scope
vertical, and scope horizontal controls to obtain a pattern
as shown in Figure 5-5.
Use
DC coupling on both the verti-
cal and horizontal scope inputs. The output voltage from
the detector will be approximately
0.8
volts. A detected
output less than 0.7 volts indicates a defective detector or
an uncalibrated scope. Each 50 MHz marker must fall with-
in
rt0.2 cm of each CM line on the scope graticule. This is
equivalent to a display linearity of
2%.
This 2% specifica-
tion is extremely important since all dial accuracy specifica-
tion are directly related to it. Repeat check on BANDS 2
and 3. In order to identify absolute frequencies on bands
2
and
3,
an external CW signal can be connected to
the EXTERNAL MARKER IN connector to identify one
of the 50 MHz harmonic markers. This also verifies the
operation of the external marker circuit.
Turn AC power on and allow the instrument to stabilize
SCOPE
il[l
Figure
5-4.
Typical Set-Up
-
-
-
-
:
R
F
DETECTOR
Model 2001
5.3
PERFORMANCE
CHECKS
The
following
procedure
is
intended
to
ensure
that
the in-
strument
meets
its
published specifications.
The
checks
specified assume
that
the
instrument
is
equipped
with
A-2
options
at
1
MHz,
10
MHz,
and
50
MHz.
While
it
is possible
to
check the
instrument's
performance
without
the
use
of
harmonic
markers,
by
using suitable
external
CW
sources, a
complete
check
by
this
method
is
impractical.
5.3.1
PRELIMINARY
CHECK
Rotate
both
START
and STOP
thumb
wheels
to
their
low-
est
frequency
position
(turn
full
left).
Both
frequency
indicators
must
read 0
MHz,
±2MHz,
when
read on the
SWEEP
WI
DTH
frequency
scale. (I
nterpolation
on
the
Sweep
Width
scale between 0 and 10
MHz
is
necessary
to
locate
+2
MHz).
Preset
controls
as
follows:
BAND
to
1,
SWE
EP
TI ME
to
LINE,
OUTPUT
to
+10dBm,
MARKER
WIDTH
to
WI
DE,
MODE
to
CW, the
four
paddle switches
to
their
extreme
down
position,
50
MHz
HAR
markers
to
on
(in
position)
and
the
remaining
markers
and
MOD
off.
Set
the
CENT
FREQ
to
250
MHz
(left
thumb
wheel) and
connect
the
power
meter
to
the RF
out
connector.
(Ensure
the
power
meter
is
on the +
10dBm
scale).
Turn
AC
power
on and
allow
the
instrument
to
stabilize
i j
WAV5TEttK
RF
~--------~HDETECTOR
MAINTENANCE
for
5
minutes.
The
power
meter
must
read between
+9.5
to
+10.5dBm.
The
calibrating
procedure
calls
for
+1OdBm
adjustment
at
300
MHz.
However,
some
error
must
be
allowed
for
changes
due
to
ambient
operating
temperature
and
variations
between
power
meters.
5.3.2
FREQUENCY
CHECKS
Connect
the
instrument
to
the R F
detector
and scope
as
shown in
typical
setup Figure 5-4. Set
the
SWEEP
WIDTH
control
(right
thumb
wheel)
to
520
MHz
and
the
MODE
switch
to
fl
F. Leave
the
rest
of
the
controls
as
previously
set in step 5.3.1.
Adjust
the
MARKER
SIZE,
the scope
vertical,
and scope
horizontal
controls
to
obtain
a
pattern
as
shown in Figure 5-5.
Use
DC
coupling
on
both
the
verti-
cal a;'ld
horizontal
scope
inputs.
The
output
voltage
from
the
detector
will
be
approximately
0.8
volts. A
detected
output
less
than
0.7
volts
ind icates a
defective
detector
or
an
uncalibrated
scope. Each
50
MHz
marker
must
fall
with-
in
±0.2
cm
of
each CM line
on
the
scope
graticule.
This
is
equivalent
to
a
display
linearity
of
2%.
This
2%
specifica-
tion
is
extremely
important
since all
dial
accuracy specifica-
tion
are
directly
related
to
it
. Repeat check
on
BANDS
2
and 3. I n
order
to
identify
absolute frequencies on bands 2
and 3,
an
external
CW
signal can be connected
to
the
EXTERNAL
MARKER
IN
connector
to
identify
one
of
the
50
MHz
harmonic
markers.
This
also verifies
the
operation
of
the
external
marker
circuit.
SCOPE
D
ii
1'"9',;.
'
'l
-t
~
fr
,
.....
_. -" -
,
ft
...,
t
'
~<;
,
\~ti
l
Figure 5-4. Typical Set-Up
5-3