Wireless Array
114 Viewing Status on the Wireless Array
number again. Click Refresh to update the information at any time. Click Auto
Refresh to instruct the Array to refresh this window automatically.
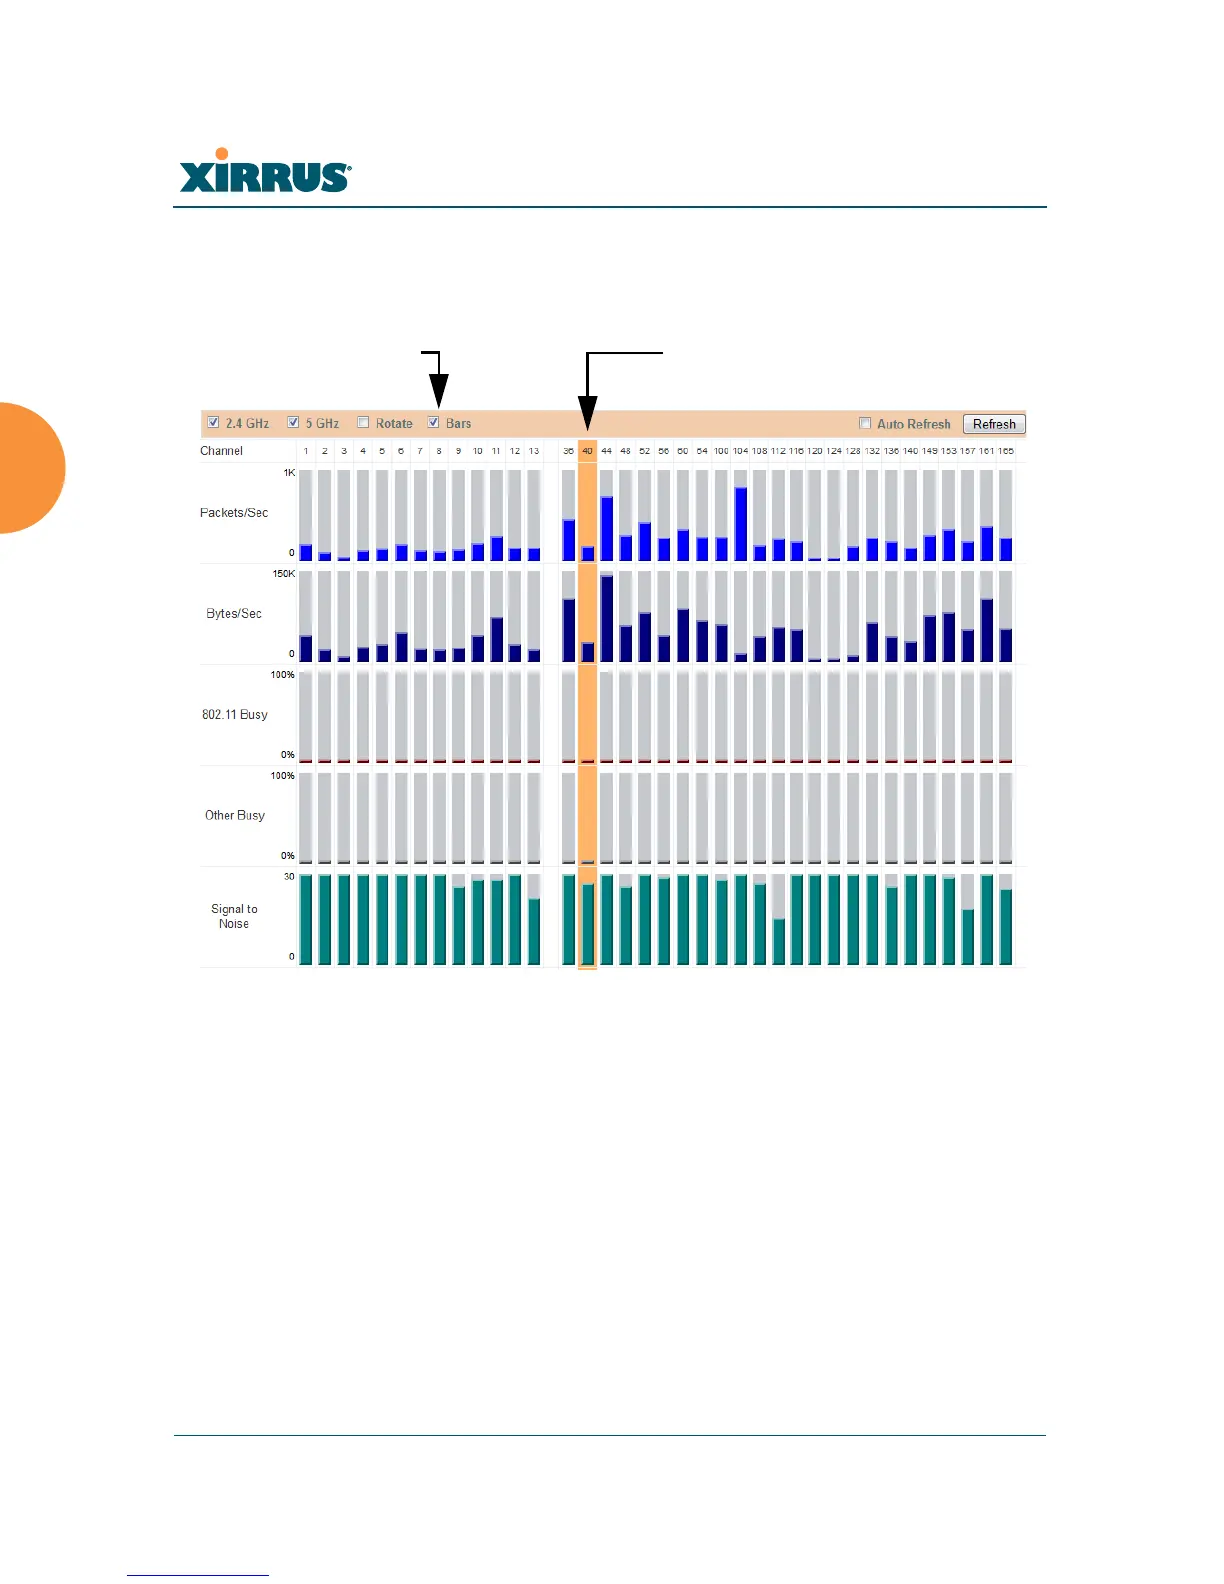
Figure 62. RF Spectrum Analyzer
The Spectrum Analyzer offers several display options:
To display horizontal bar graphs, click the Rotate checkbox at the bottom
of the data window.
In the rotated view, if you wish to view data as a numerical table, click the
Te xt checkbox. Click again to return to a graphical display. The text
option is only available in the rotated view.
When viewing a graphical display, click Bars to have the bar graphs
displayed against a gray background — you may find this easier on the
eyes. This operation is not available when Text is selected.
 Loading...