pg | 53
Clear Buer: As in the Dashboard, the data buer can
manually be saved to a le using the Capture Data button.
Alternatively the buer data can be cleared using the Clear
Buer button. Once the buer is cleared, it cannot be
recovered.
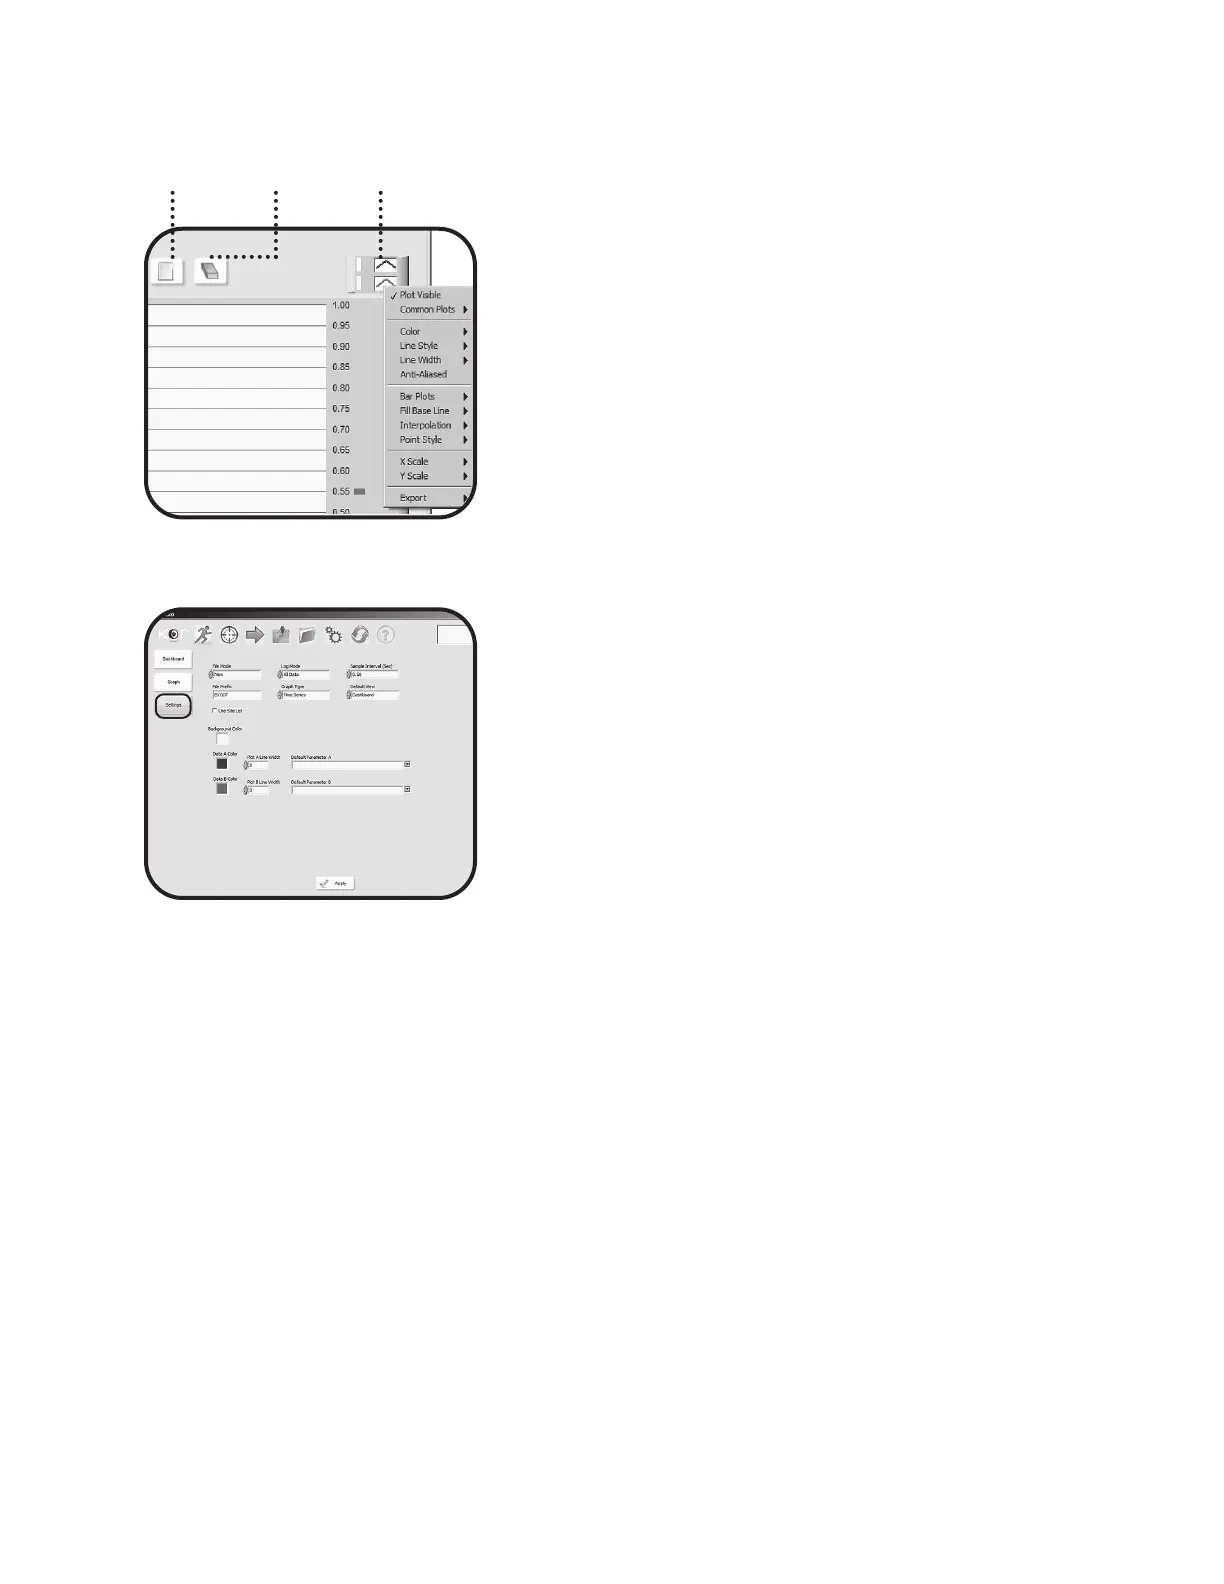
Advanced Plot Tools are available to manipulate the graph.
Explore these features by clicking either of the small plot
lines in the upper right corner immediately above the plot
to reveal the submenus.
Settings
e Settings menu denes the preferences for the RUN
mode. Plot line colors and width can be chosen, as well
as the default plot parameters. While all parameters are
available to set as default, the connected device must have
the corresponding sensor installed in order to plot the data.
File Mode: When using the Capture Data button, data
will be saved to a le. When the le mode is set to NEW, a
new data le will be created. When the le mode is set to
Append, subsequent data is captured into the same le.
Log Mode: Controls the amount of data saved to a le.
ALL data sends the entire real-time data buer (up to 1000
points for every parameter), while Last Point records a
single data set (1 point for every parameter).
Sample Interval: is option corresponds to the refresh rate
of the graph and dashboard. 1 sample per second (1 Hz)
is typical for most real-time display; once per second new
readings are posted to the buer and updated on the display.
e sampling rate on the real-time display is limited to 4
samples per second (4 Hz) because of the processing eort
of transferring the information to the PC.
File Prex: is prex is the le name that will appear at
the beginning of the captured data le. KOR automatically
applies a unique identier name on all les generated. e
user can change this setting, but the le prex allows users
to give the captured le a name.
Graph Type: Choose between Time Series or Proling
graph displays. For future functionality; not active yet.
Default View: e Default View allows the user to choose
between Dashboard or Graph as the default display when
KOR automatically opens the Run menu.
Apply: When a eld is edited in the Settings menu, the user
must click the Apply button to commit those changes. If you
edit a eld, then attempt to navigate away, a warning box
appears to remind you to apply or discard your changes.
Capture
Data
Clear
Buffer
Advanced
Plot Tools
 Loading...