107
4
1.
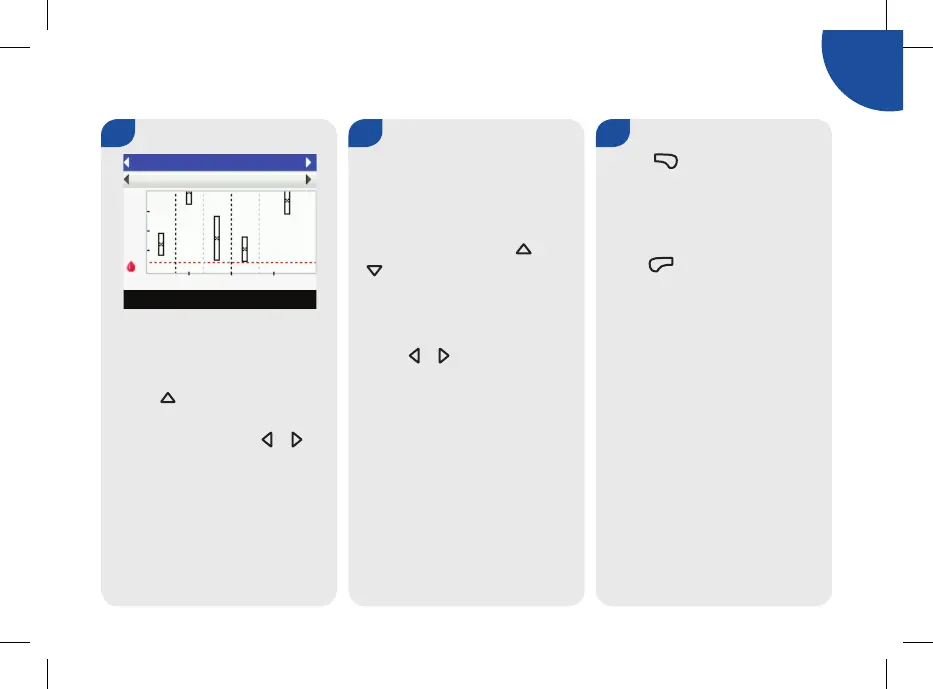
j To display a standard day
graph for another time range
(last 7, 14, 30, 60, or 90 days),
press
x
to highlight the time
range selection eld (top of
screen). Press either
< or >
until you reach the time range
you need.
2.
j To display a standard day
graph for another meal
time selection (Overall, Pre
Meal, Post Meal, Bedtime,
or Other), press either x or
z to highlight the meal time
selection eld (immediately
below the time range which is
at the top of the screen). Press
either
< or >
until you reach
the meal time selection you
need.
Standard Day Graph
3.
j
Press . to display the Table
(proceed to the next section for
more information).
To return to the Reports screen,
press ,
.

 Loading...