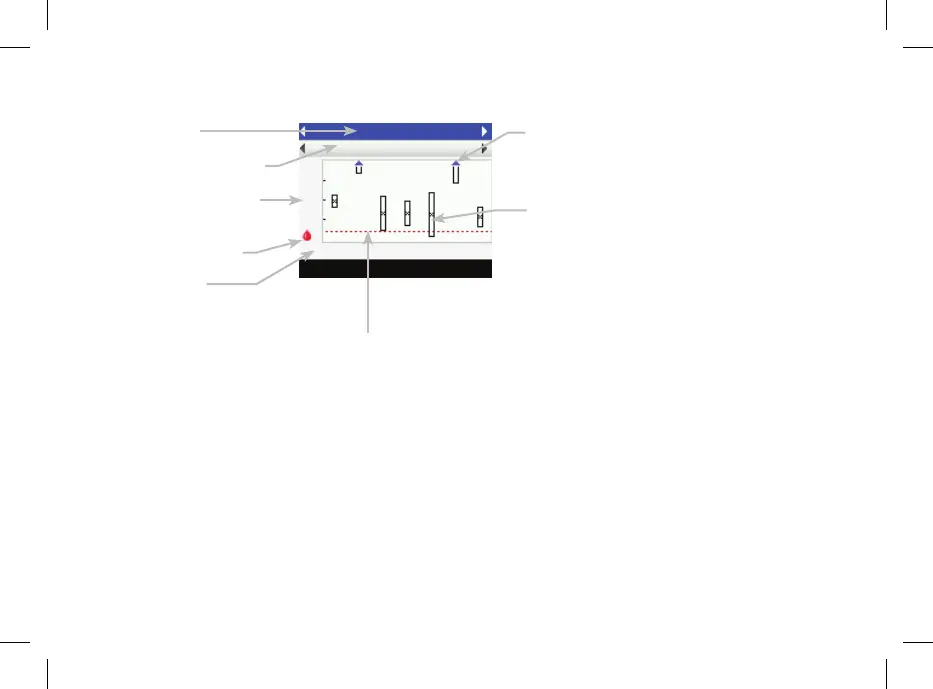
Standard Week Graph Screen
Time Range
Meal Time Selection
Blood Sugar Unit of
Measure
Blood Sugar Icon
Day of Week
Arrow
Indicates blood sugar average is off the top
of the graph (“X” is not displayed)
Box for Each Time Block
• “X” in center of box indicates the average
of all blood sugar results for the selected
criteria.
• The top of the box indicates one standard
deviation above the average and the
bottom of the box indicates one standard
deviation below the average. The box is
not displayed if there are not enough data
to determine standard deviation.
• The top of box is open if the standard
deviation is off the top of the graph.
• Box and “X” are not displayed for a day if
no data are found.
Warning Limit Hypo Level
Red horizontal line

 Loading...