121
4
Reporting Your Target
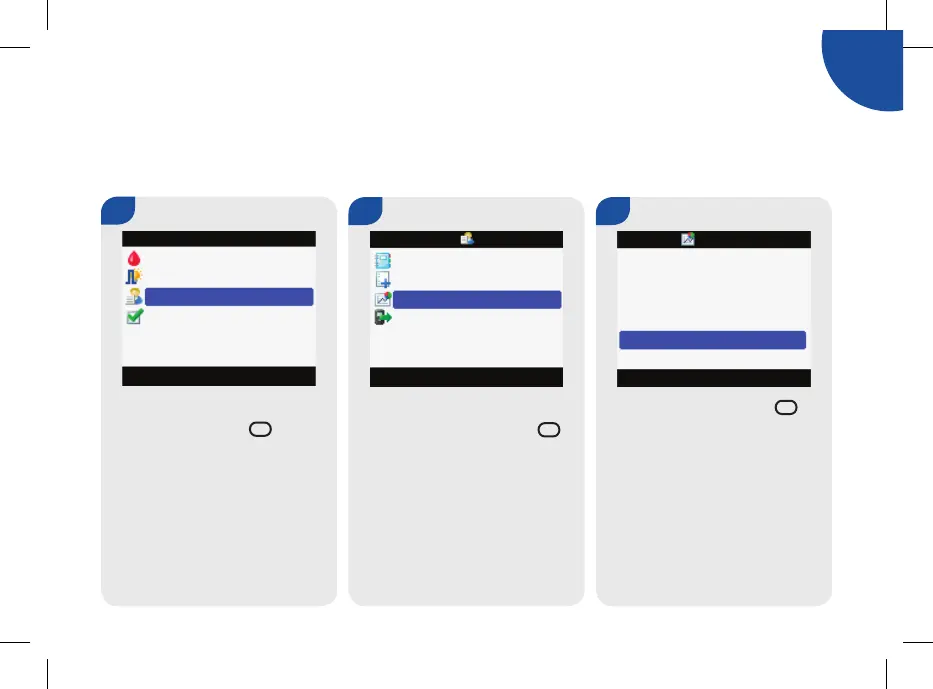
The meter displays a pie chart illustrating your blood sugar records as “Above,” “Within,” “Below,” and
“Hypo” for the time range you choose (last 7, 14, 30, 60, or 90 days).
Main Menu > My Data > Reports > Target
1.
j From the Main Menu, select
My Data and press =.
2.
The My Data screen appears.
j Select Reports and press =.
 Loading...