Contents ▲ 164 ▼ Index
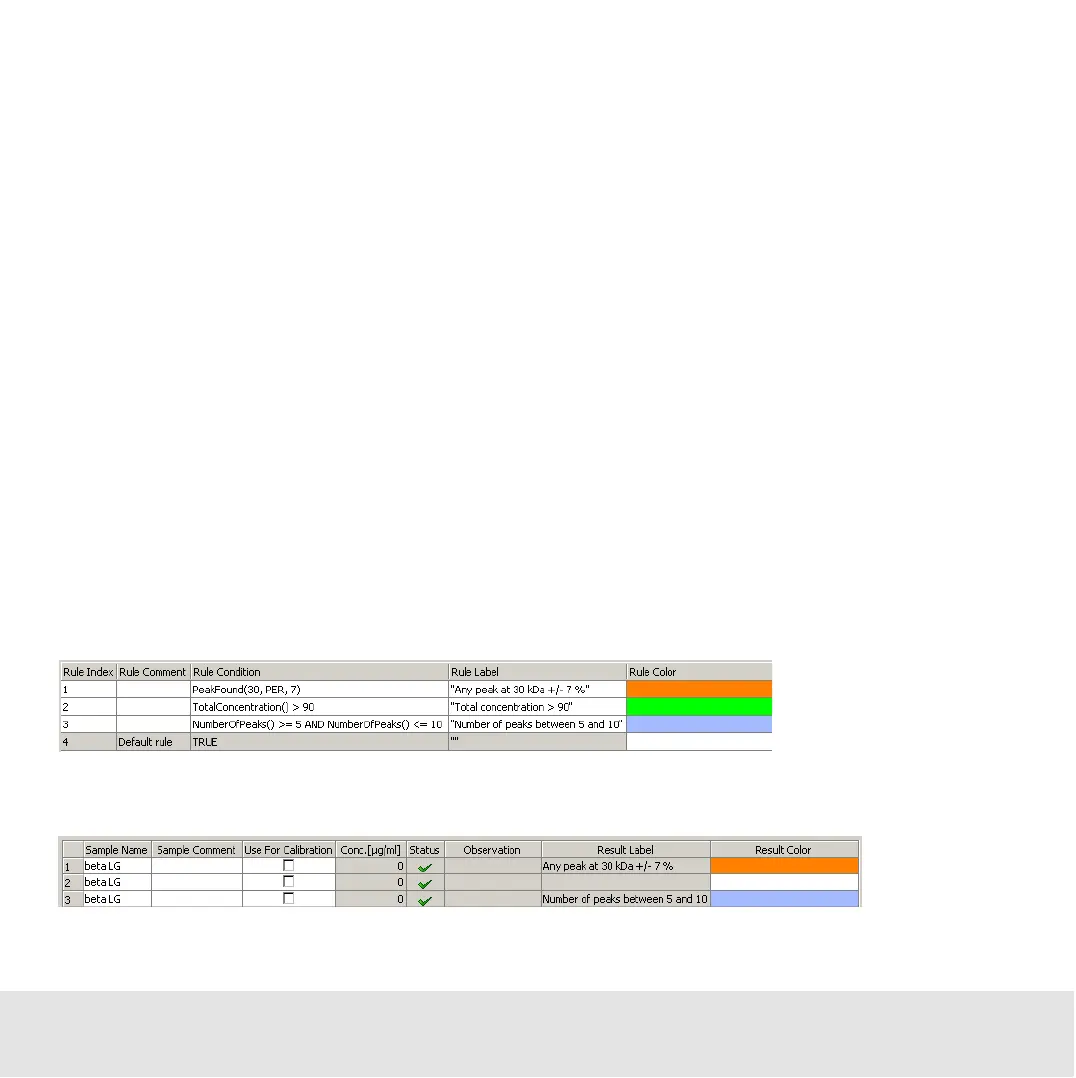
Example: Result Flagging
Sample 1 contains 100 µg/ml proteins. The electropherogram shows 2 peaks for 2
different proteins, which could be separated. One peak can be found at 32 kDa (LDH).
Sample 2 contains 60 µg/ml proteins and shows 3 peaks.
Sample 3 contains 80 µg/ml proteins and shows 5 peaks.
Now, the following rules are defined:
1. Is there a peak at 30 kDa +/- 7%?
Rule 1:
PeakFound(30, PER, 7)
2. Is the total concentration of proteins higher than 90 µg/ml?
Rule 2:
TotalConcentration() > 90
3. Were 5 to 10 peaks found?
Rule 3:
NumberOfPeaks() >= 5 AND NumberOfPeaks <= 10
Alternative Rule 3:
NumberOfPeaks() BETWEEN (5,10)
Applying these rules in the given order (in Normal mode) leads to the following results: