Contents ▲ 172 ▼ Index
Generating Histograms
2100 expert counts the events, sorts them and displays them according to their
fluorescence intensity in histograms. For each color measured, a histogram displays the
number of events related to the fluorescence intensity. A large number of events with a
high fluorescence value means that a large number of cells containing the fluorescence
dye were detected.
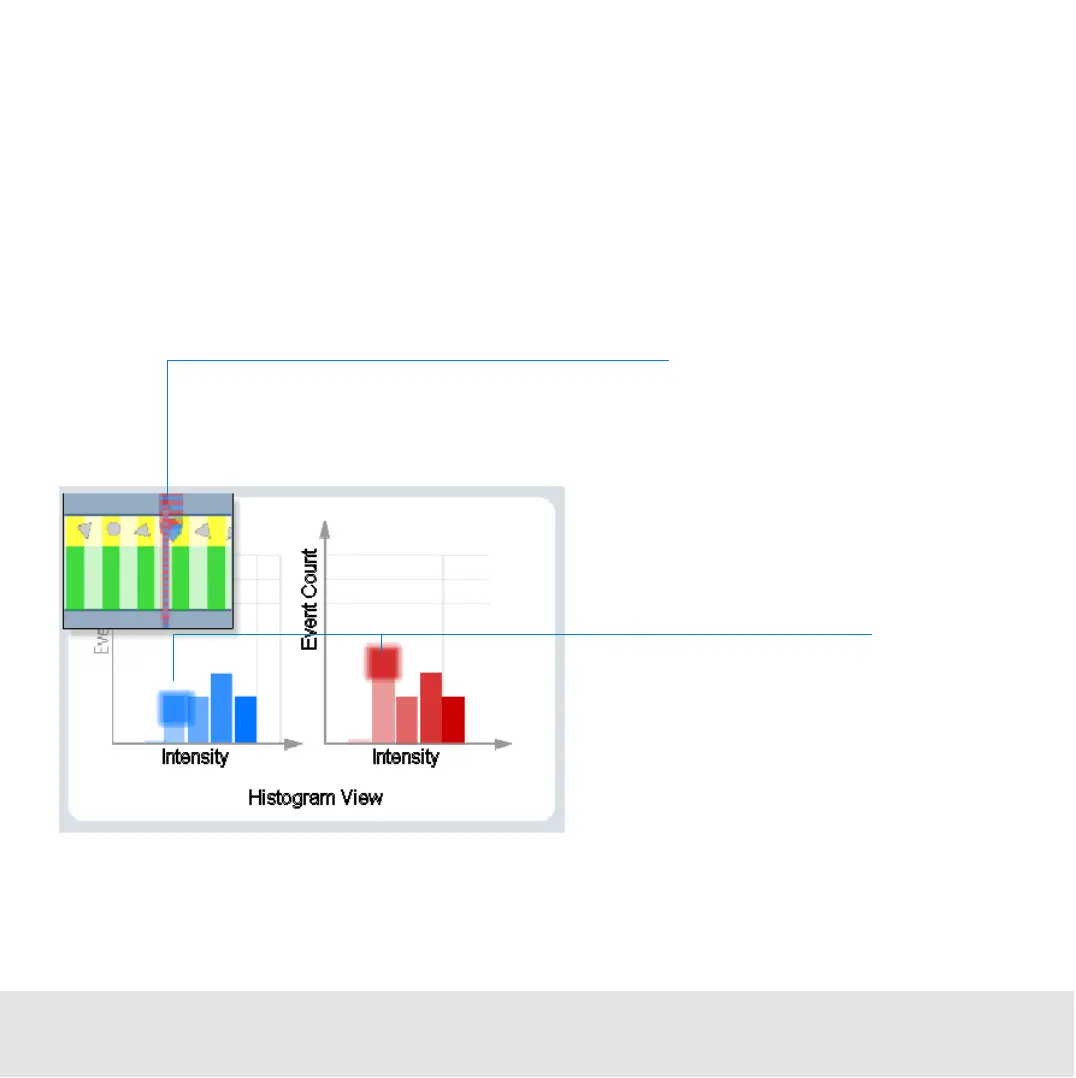
In the following illustration, cells which fluoresce in both colors are highlighted.
As a cell passes through the detector, its blue and red fluorescence values
are measured and the count is increased for both channels at the
appropriate intensity.
Illustrates a cell that
fluoresces in blue and
red. The height of the
bars is related to the
number of cells with this
fluorescence value.
 Loading...


