Contents ▲ 210 ▼ Index
To display data points in histograms:
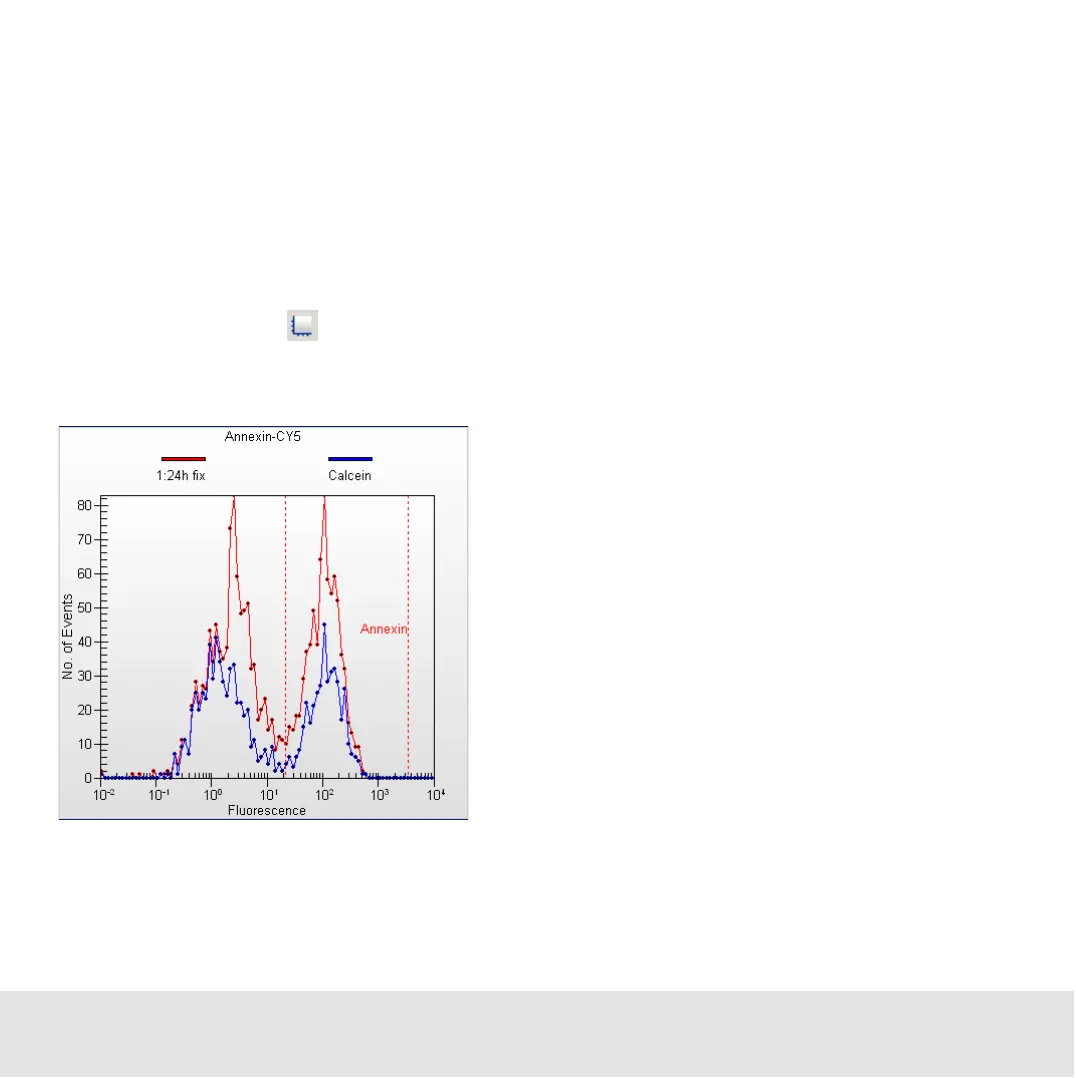
1 From the Histogram menu, select Show Data Points.
All events are shown as bullets.
To put a color gradient on the background of a histogram or dot plot:
1 From the Histogram or Dot Plot menu, select Gradient.
– OR –
Click the Gradient button the histogram or dot plot toolbar.
A color gradient (gray to white) appears on the background of the graph.