Contents ▲ 251 ▼ Index
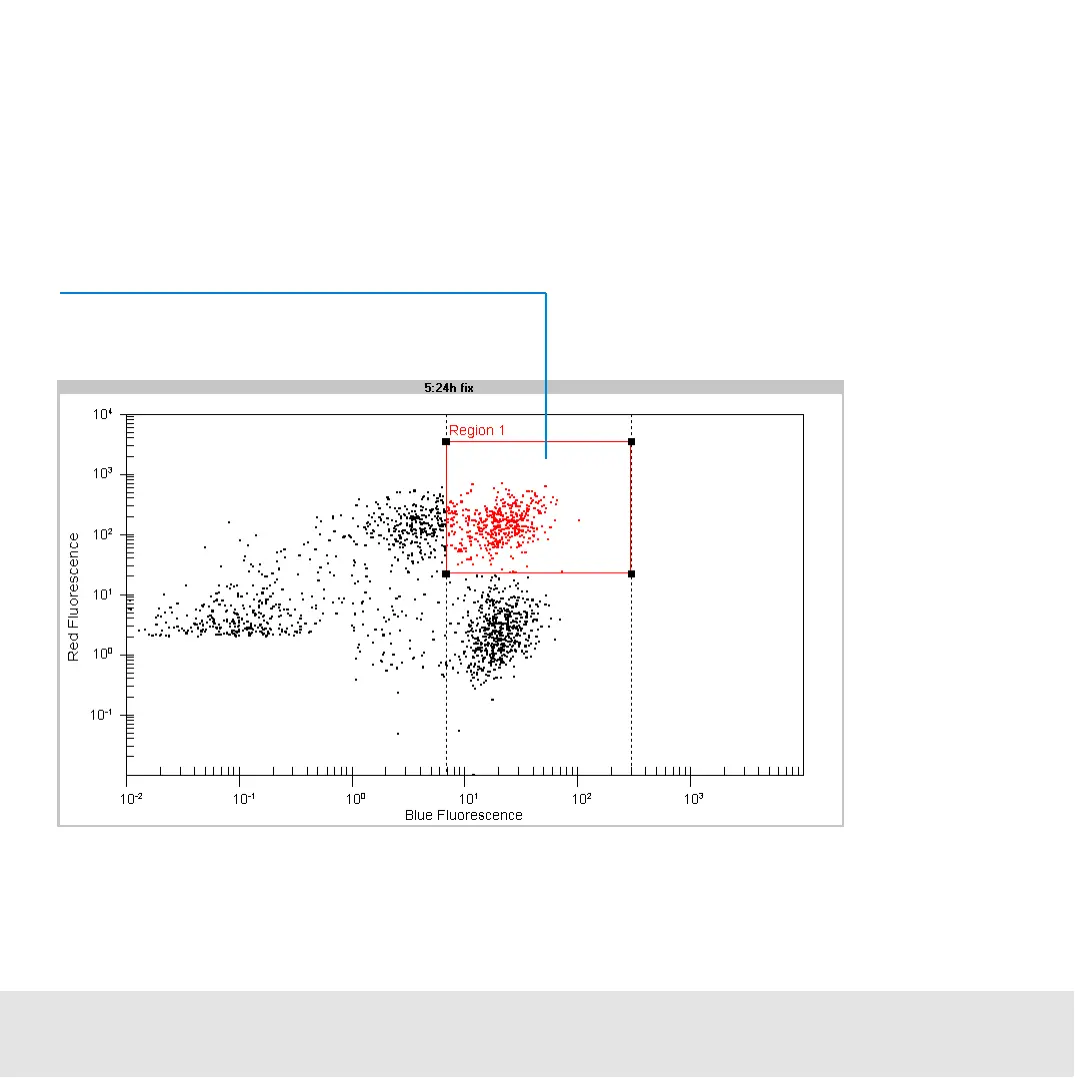
Dot plot evaluation
If you switch to the Dot Plot tab, one region is displayed in the dot plot. The red
fluorescence values of the region are related to the marker in the red histogram, the blue
fluorescence values to the marker in the blue histogram. As in the histogram evaluation,
high blue fluorescence and high red fluorescence represent living cells with annexin V
binding. See the following example.
Cumulation of high blue and high red
fluorescence indicate living apoptotic cells

 Loading...


