Contents ▲ 254 ▼ Index
The values are displayed in the result table, each histogram has its own table.
After gating by using the red histogram, in the blue histogram only CBNF-stained cells
are displayed. High blue fluorescence values indicate GFP-producing cells. See the
following example.
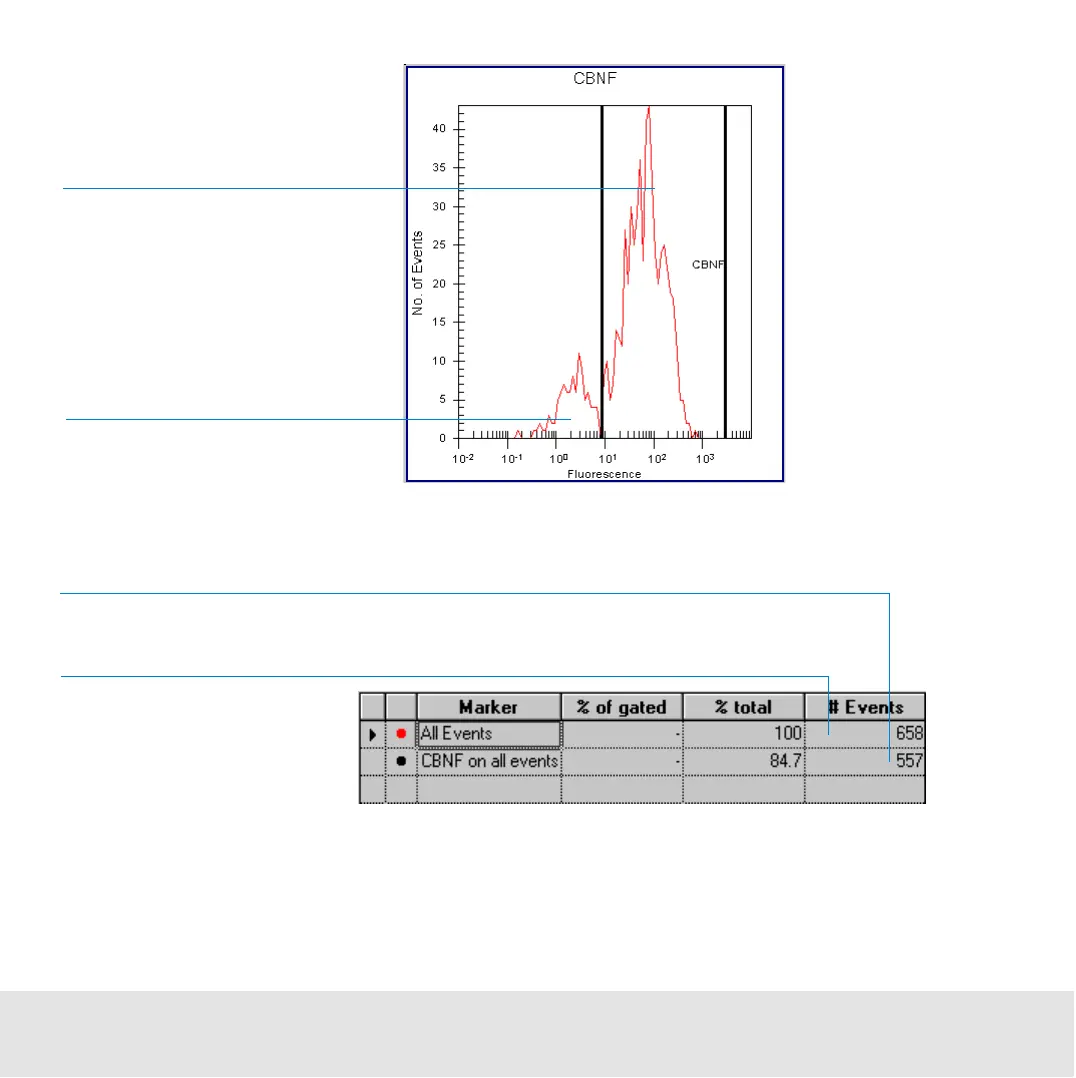
Low fluorescence value
indicates dead cells
High fluorescence value is
associated with living cells
All measured events
All events related to the red marker (here CBNF)

 Loading...


