USING THE OTOWAVE 302+
36 OTOWAVE 302+ INSTRUCTION FOR USE
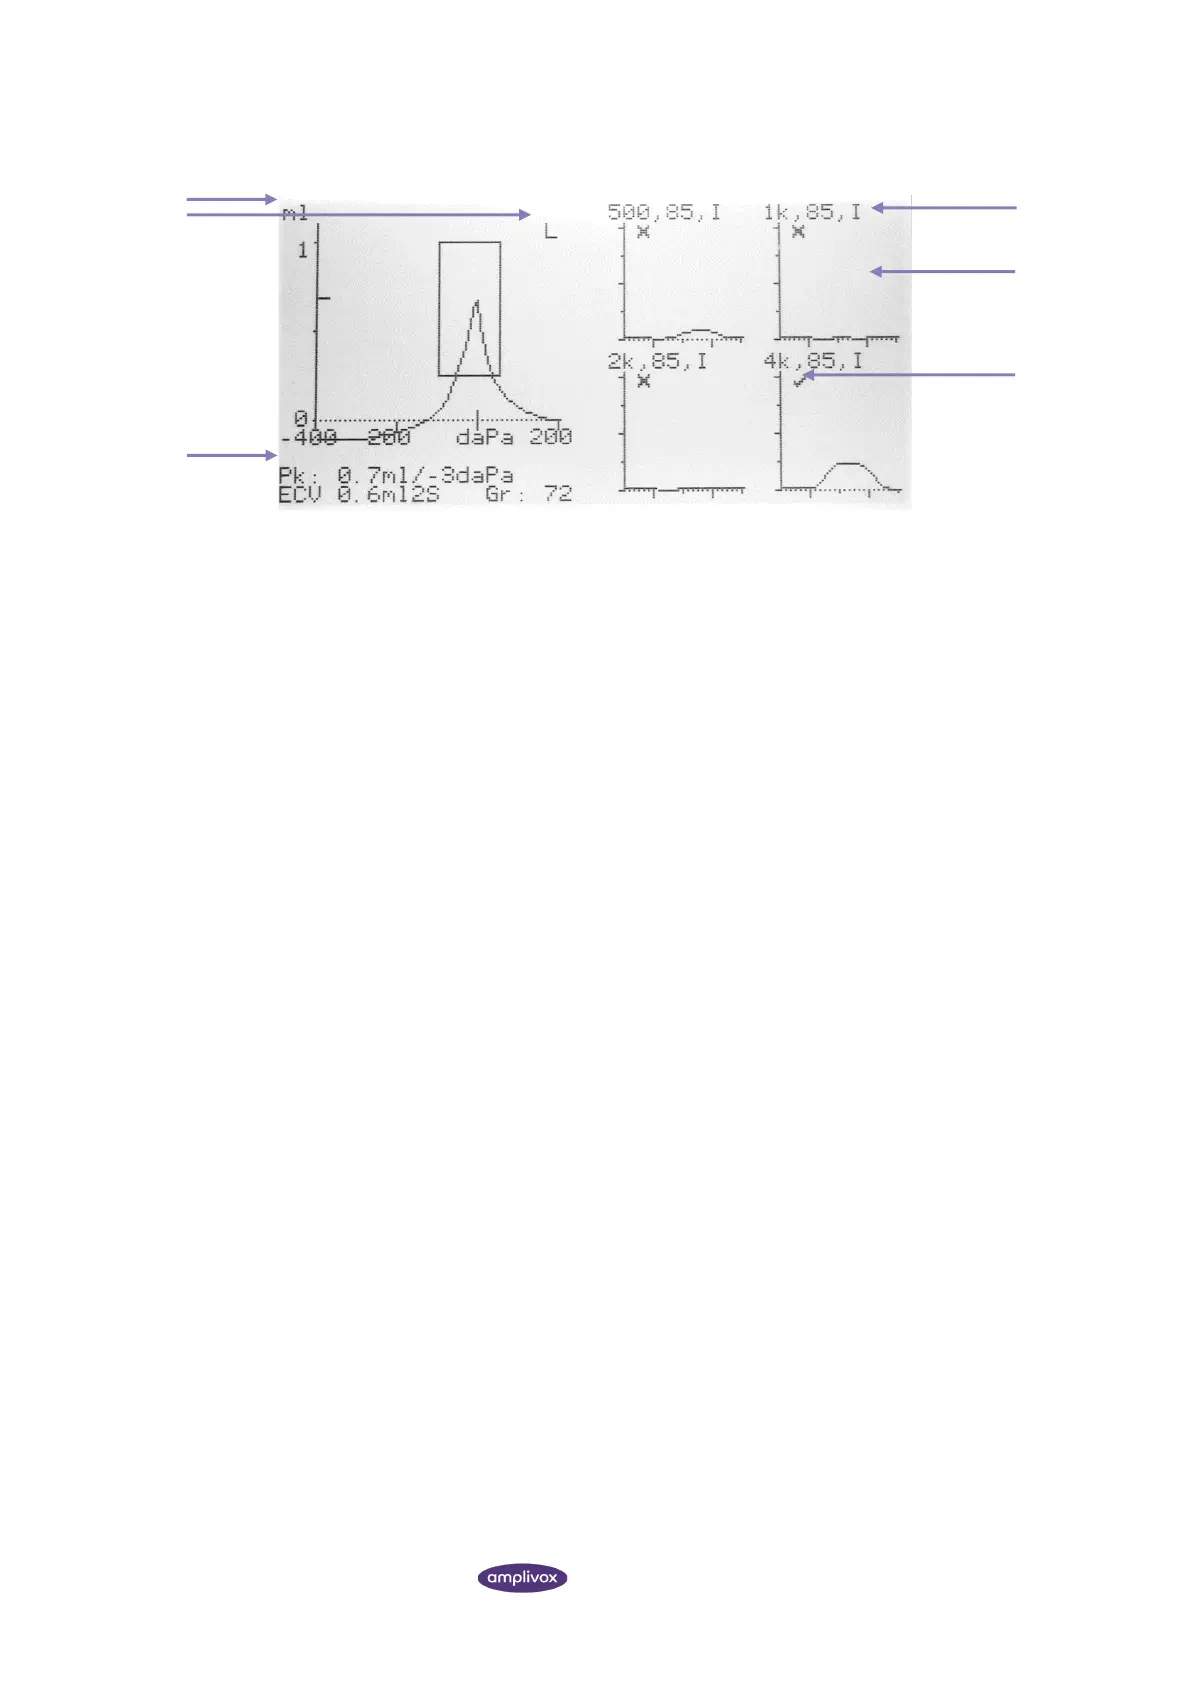
Tympanogram on the left-hand side and the four reflex traces shown on the right.
Ear side, L for left and R for right.
Values defining compliance curve based on cursor position and the Baseline Mode
• Pk (Peak): Volume in ml or mmho, pressure in daPa
• The Ear Canal Volume (ECV) in ml measured at the Baseline Mode
• Gr (Gradient): Width of compliance curve at half of peak compliance in daPa
Four reflex traces, containing frequency of the reflex stimulus, lowest level of tone (dBHL) at which a reflex was
found, and the type of reflex stimulus used (I for ipsilateral, C for contralateral).
Graphiical display of reflex. To view the reflex traces in more detail press ►. One of two displays will then be
shown depending on whether or not Reflex autostop has been selected.
• Single frequency used: Diagrams contain the different levels tested for the specific frequency.
• Several frequencies used: each diagram represents 1 frequency, showing only the intensity where a
reflex was detected.
“✓” if a reflex was found, otherwise “X”.