UG-1308 EVAL-ADuCM355QSPZ Evaluation Board
Rev. A | Page 14 of 24
Current through SE0.
Voltage o
n SE0.
Voltage on RE0
.
Curren
t through SE0 measured a second
time.
T
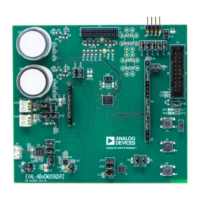
o plot the current response of the test, open the saved .csv file in
Microsoft® Excel. Figure 23 shows the plotted response current.
–600
–500
–400
–300
–200
–100
100
0
200
300
500
400
600
1
17
33
49
65
81
97
113
129
145
161
177
305
193
209
225
241
257
273
289
321
337
353
369
385
CURRENT (µA)
INDEX
16887-017
Fi
gure 23. Example SE0 Channel Current Measurement
EIS EXAMPLE
EIS is a common electrochemical measurement in which an ac
excitation signal is applied to an electrochemical cell. The response
current is measured, and the impedance is calculated.
On the ADuCM355, the EIS measurement is a three-step process.
The response current in each step is measured using a high
speed transimpedance amplifier (TIA).
The EIS measurement process is as follows:
1. A signal is applied across R
CAL
.
2. A sig
nal is applied across R
LOAD
.
3. A sig
nal is applied across Z
SENSOR
+ R
LOAD
.
In each ste
p of the measurement processes, the measured current is
input to the discrete Fourier transform (DFT) hardware accelerator
that calculates the complex number of the current measurement
and provides the real and imaginary parts. R
CAL
is a precision
resistor connected to the ADuCM355 RCAL0 and RCAL1 pins,
R
LOAD
is the internal load resistor on the SE0 path, and Z
SENSOR
is
the impedance under test.
Use the following equation to calculate the actual impedance:
Z
SENSOR
= (Z
SENSOR
+ R
LOAD
)− Z
RLOAD
where:
Z
SENSOR
+ R
LOAD
is the impedance of R
SENSOR
and R
LOAD
measured
together as a single impedance.
Z
RLOAD
is the impedance of R
LOAD
.
Open the M355_ECSns_EIS example project in the preferred
IDE. For the purpose of this initial test, a dummy electrochemical
cell is used. Connect three 1 kΩ resistors in a star network, and
connect the star network to the CE0, RE0, and SE0 pins on P5
of the EVAL-ADuCM355QSPZ (see Figure 22).
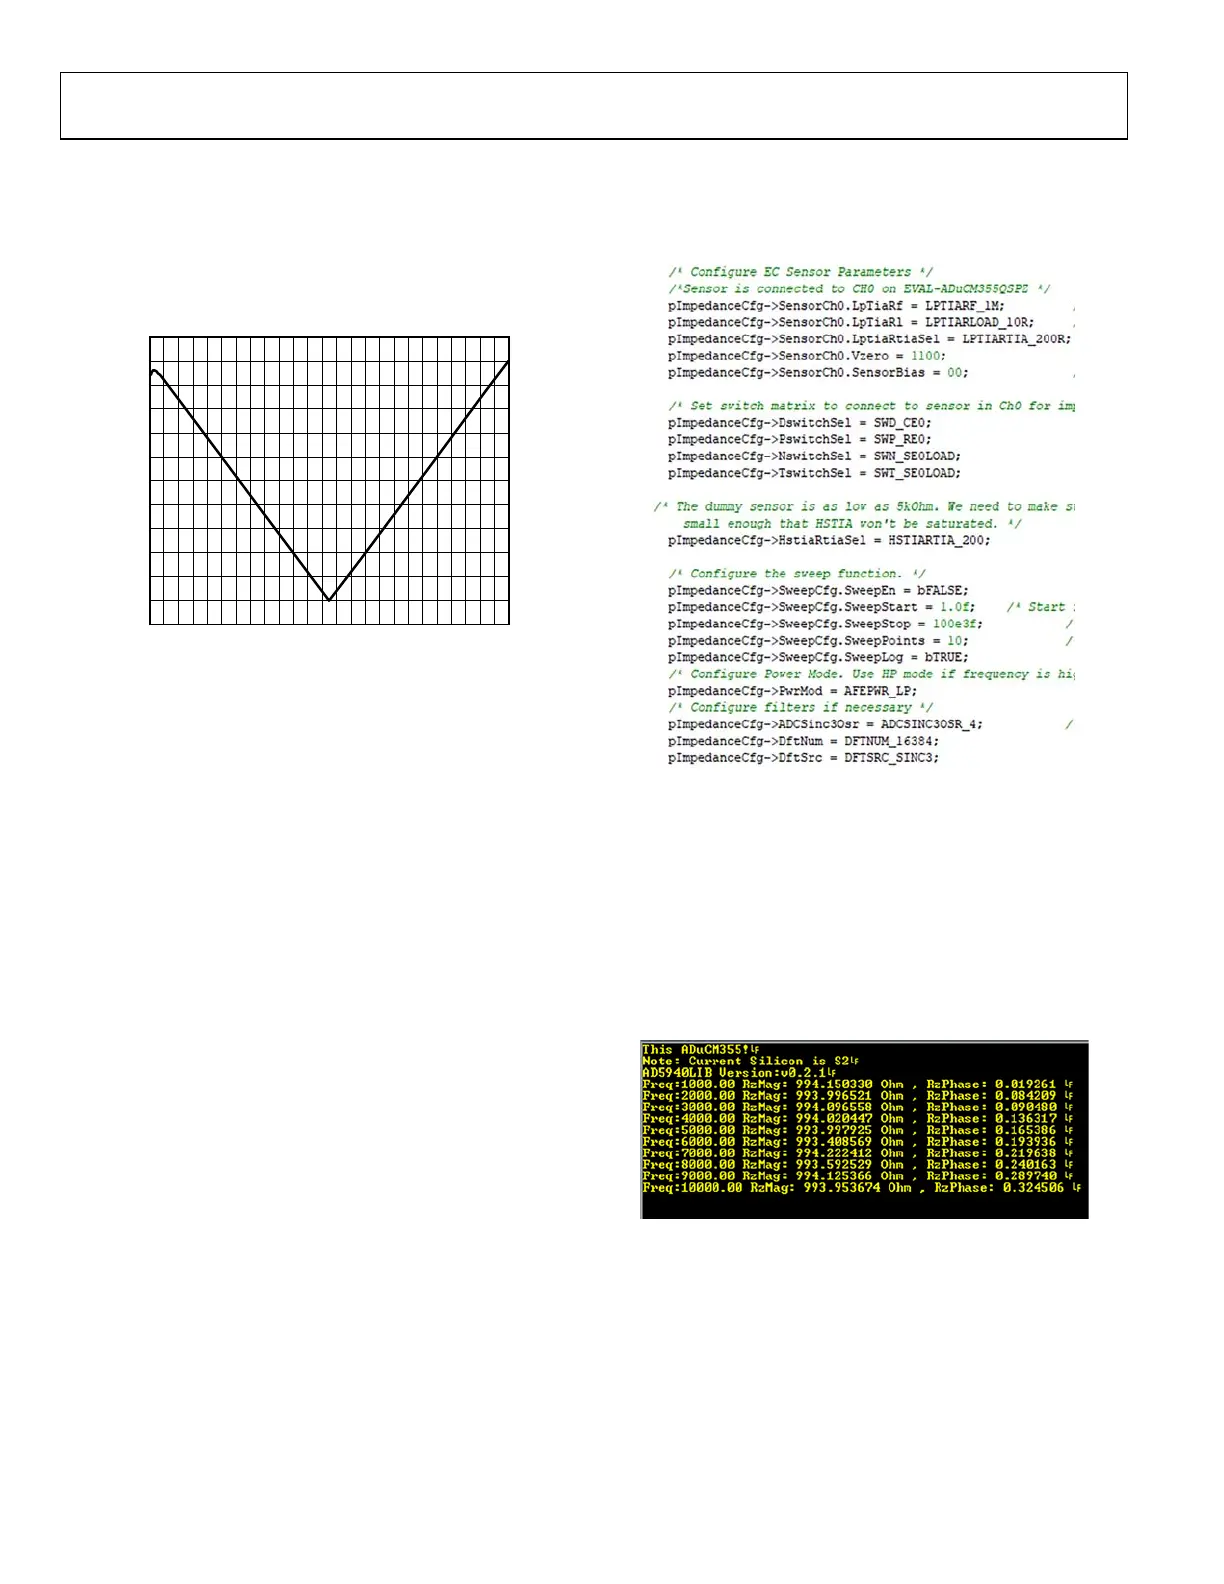
In the AD5940Main.c file, there are several configurable
parameters that are shown in Figure 24. To couple the ac excitation
signal on top of a dc bias, set the SensorCH0.SensorBias parameter.
To apply a frequency sweep, modify the SweepCfg parameters.
16887-225
Figure 24. EIS Parameters
To run the impedance measurement, take the following steps:
1.
Launch the debugger in the IAR Embedded Workbench.
2. Open a terminal program with a 230,400 bps baud rate.
3. Execute the code.
4. A prompt to press the S2 switch is sent over the UART and
displays in the terminal. Press S2 to begin the impedance test.
5. When the impedance measurement completes, the results
are sent to the UART (see Figure 25). Save the results in a
Microsoft Excel file for further analysis, if necessary.
16887-019
Fi
gure 25. Impedance Results
CHRONOAMPEROMETRY EXAMPLE
Chronoamperometry is an electrochemical technique in which
the voltage applied to an electrochemical cell is stepped. The
response current on the sense electrode is measured. Figure 26
and Figure 27 show typical chronoamperometric measurement
and sensor responses.
 Loading...