28
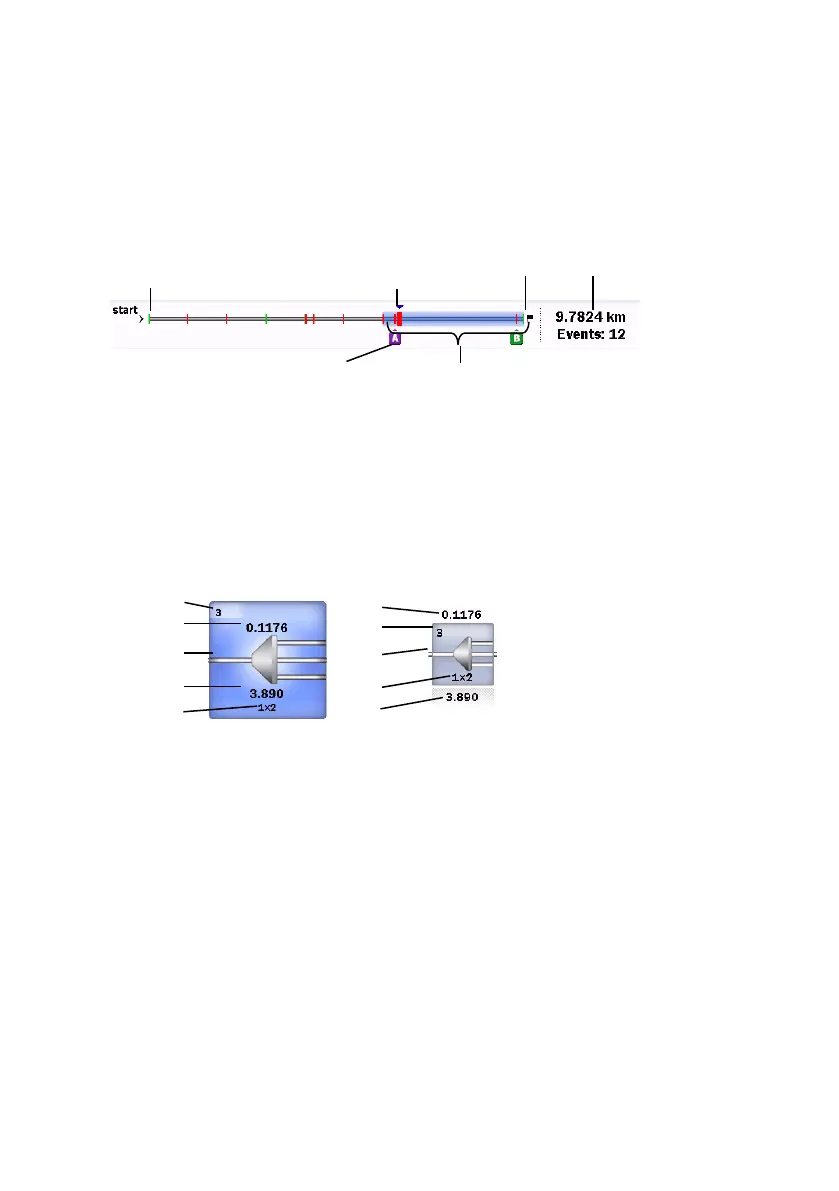
Fiber Schematic
Fiber Schematic shows event positions or event icon positions on display.
The events that exceed the PASS/FAIL thresholds are displayed in red.
The range where event icons are displayed is indicated by light blue bar.
Trace Events
The automatically detected points such as connection point, splice points
or splitter are indicated by the icons. The icon in red indicates the loss
exceeds the threshold level.
The trace near the selected event is displayed in the lower right.
Range where event
icons are
displayed
Number assigned sequentially from the ACCESS Master side
Distance from the ACCESS Master side
Icon of the event type
Splice loss at the event: (dB)
E. Number of branches (only for splitter)