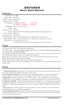
When the radio power is lower than 10W and the standing wave exceeds 3, the display interface
Standing wave change trend
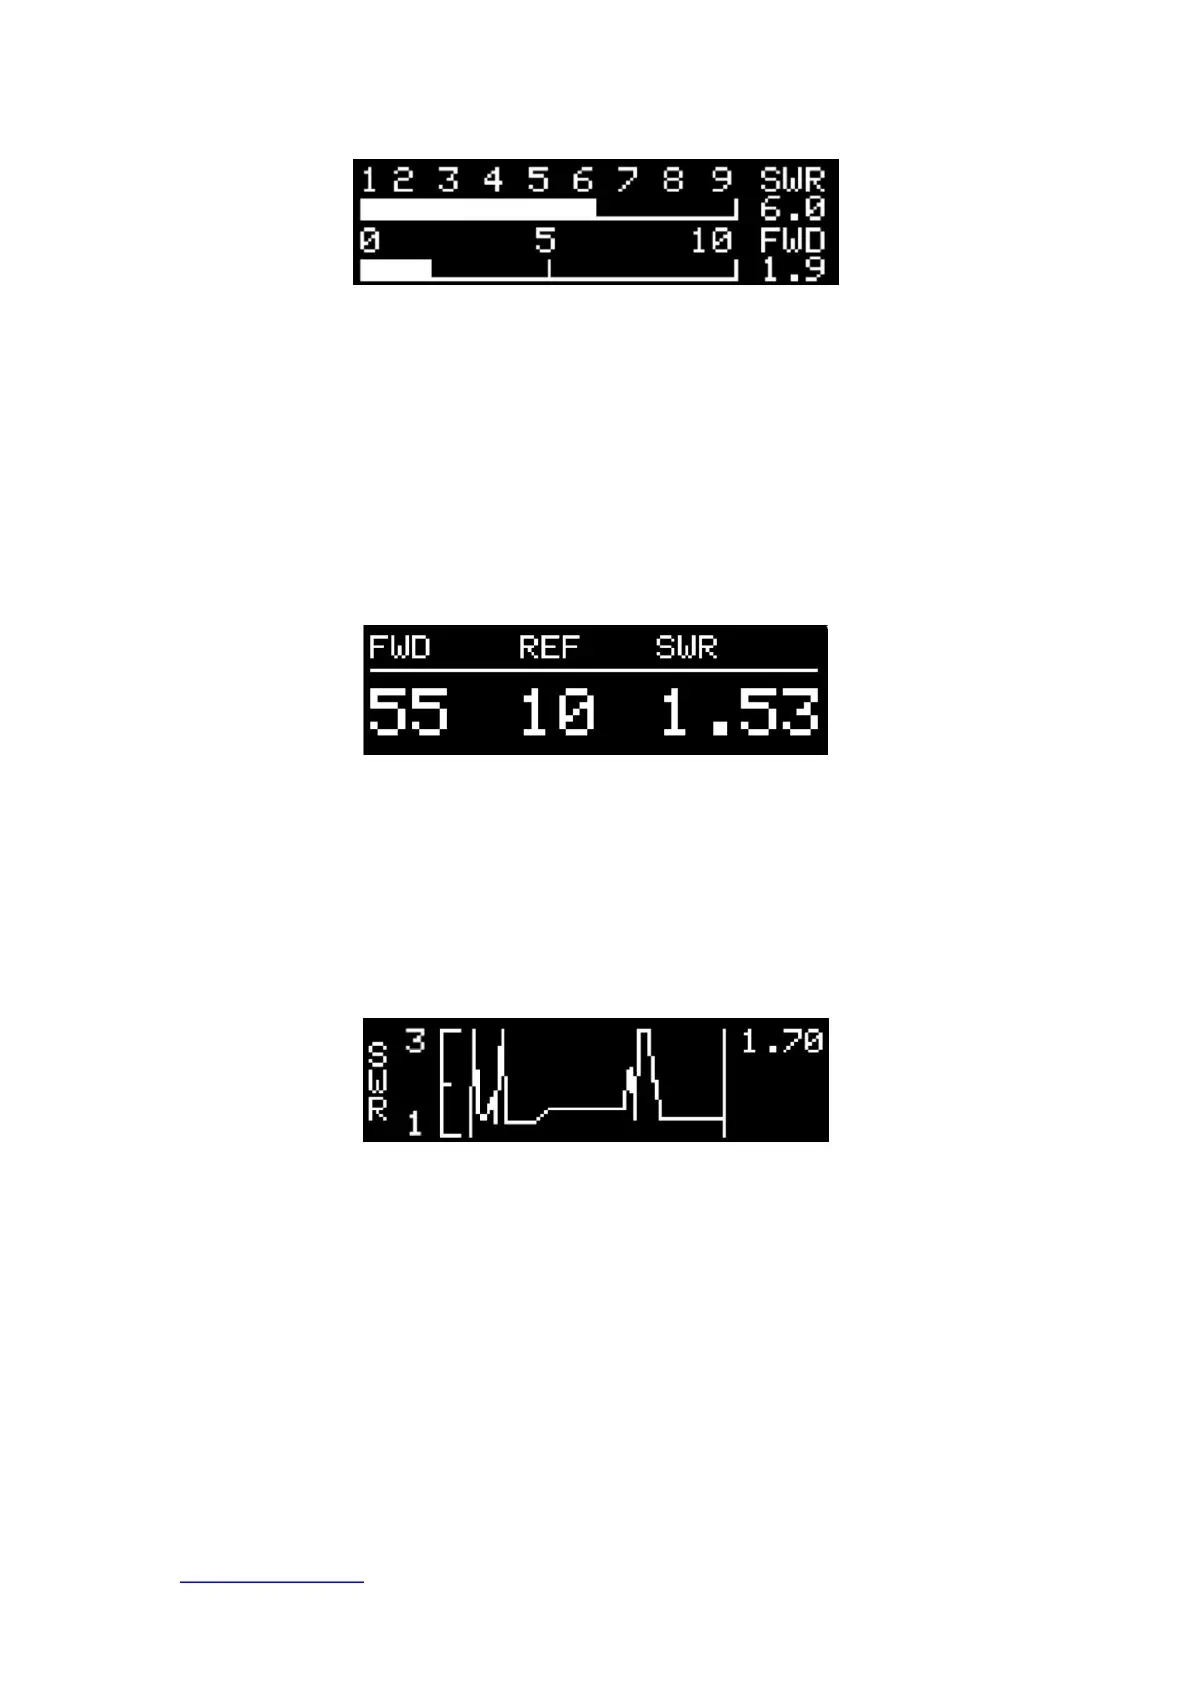
Various values in the emission state
ÿ
ANTUNER only researches ultra-small, portable radio peripherals, and completely develops software and hardware at the bottom
http://www.antuner.com
BI3QWQ
ÿ
trend.
2) Large font interface (forward power, reverse power, standing wave value)
When switching to this time, if the standing wave is lower than 3.0, 3.0 will be the maximum value, and if it exceeds 3.0, 9.99 will be displayed as the maximum value.
When the standing wave value < 3, the maximum value displays 3.00; when the standing wave value > 3, the maximum value displays 10
3) Standing wave line graph interface
"1.70" in the upper right corner of the screen is the standing wave value monitored in real time.
range 0.0-999), REF is the reverse power (0.0-999), SWR (1.00-9.99) is the current standing wave value.
display 100W; when > 100W, the maximum display is 200W
ÿ
The interface of this function is displayed in large font, suitable for friends who are older and have poor eyesight, where FWD is forward power (range
This function interface mainly displays the standing wave change trend in real time in the form of a broken line graph, and the detectable standing wave range is 0-9.99
When the forward power < 10W, the maximum value displays 10W; when 10Wÿ forward power < 100W, the maximum value displays
You can use this interface to continuously adjust the frequency with the radio station to realize the "antenna analyzer" function and understand the standing wave of the antenna feeder
Machine Translated by Google