Hi Flow Sampler Operation
Instruction 0055-9017
35
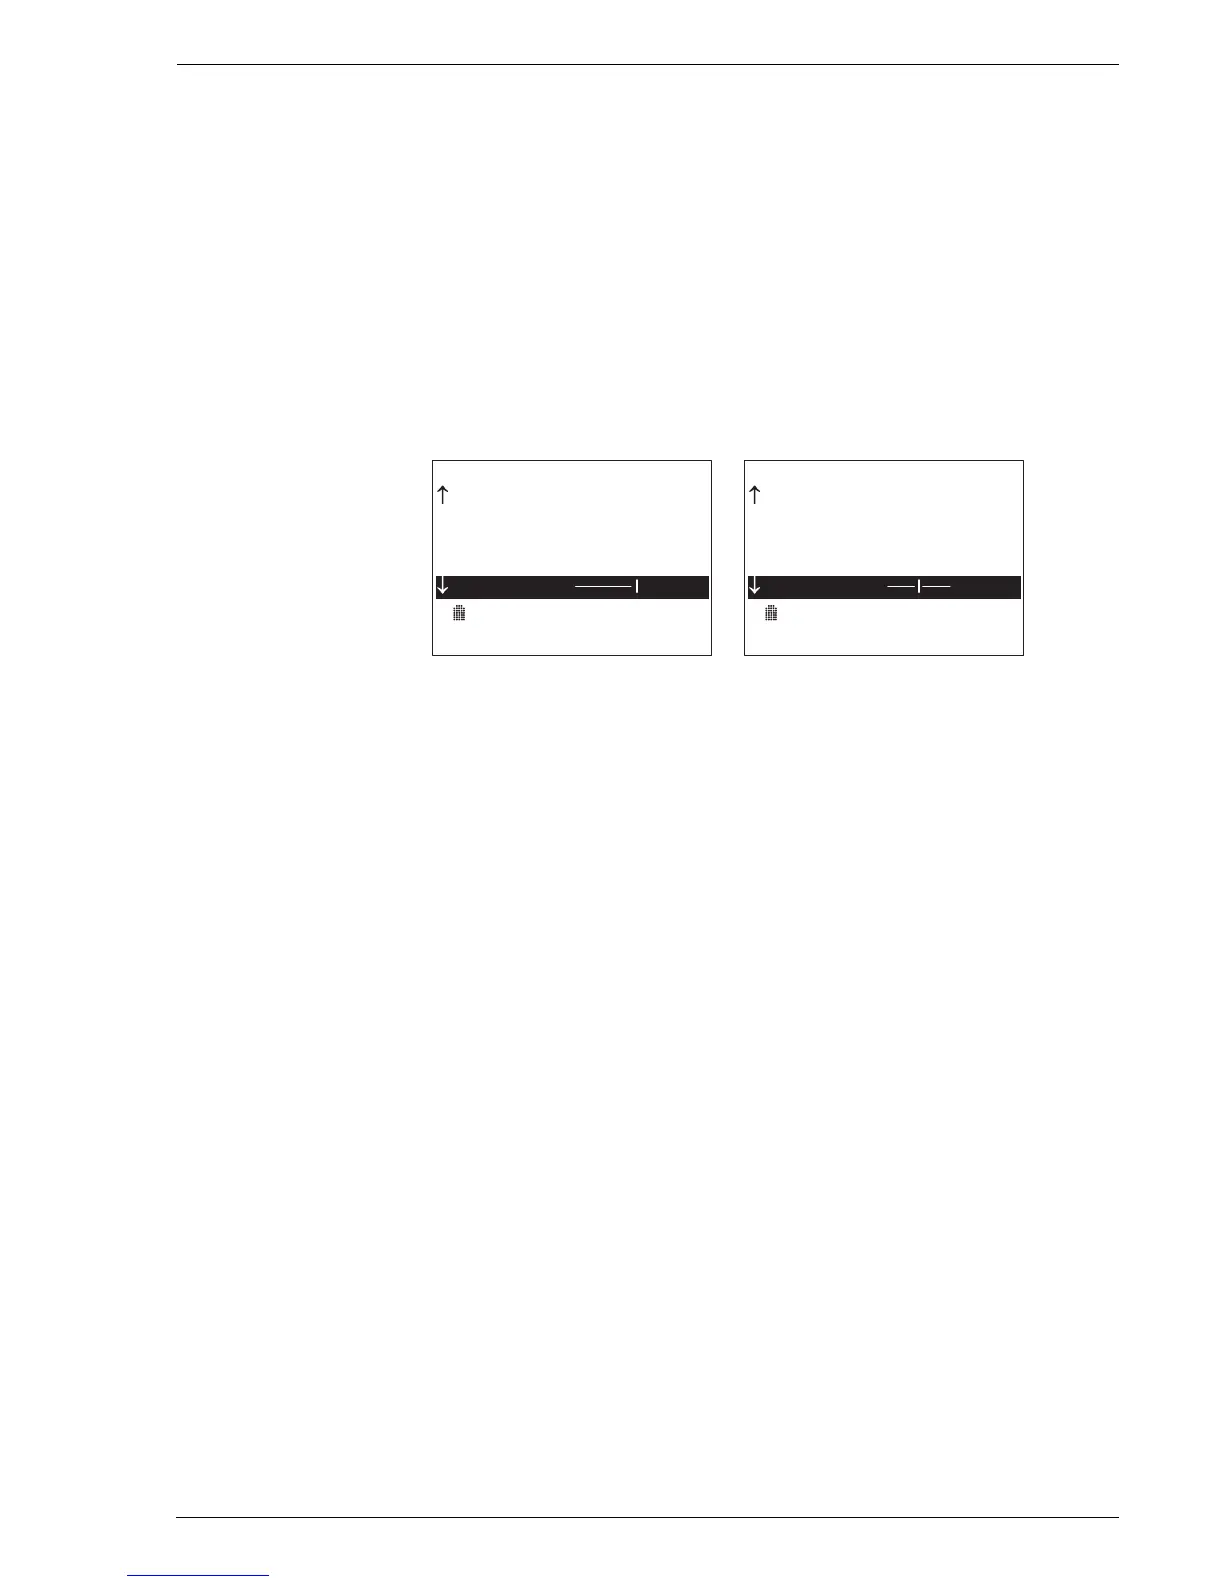
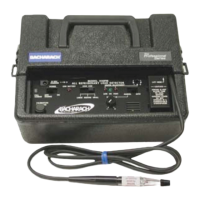
7. After both measurements are complete, the values in the Main Screen
are put on hold (as indicated by “H--” appearing at the bottom of the
screen), allowing the user to make note of these values before turning off
the instrument or proceeding to the next measurement.
In the examples below, the measured leak concentration was 15% gas
during the first measurement and 18% gas in the second, while the
calculated leak rates were 42.5 and 40.8 lpm, respectively. A difference
of 4%.
Important: For a test to be considered valid, the percent difference
between measurements #1 and #2 must be less than 10%. Scroll up to
the #1–#2 function on the Main Screen to see the percent difference
between the last two measurements.
1 1 / 2 2 / 0 4 1 0 : 4 6 : 3 0
F l o w ( l p m ) 2 1 6 . 5
B a c k ( % ) 0 . 8 0
L e a k ( % ) 1 5 . 0 0
L e a k ( l p m ) 4 2 . 5
S p e e d ( L O < > H I )
S a m p l e T i m e - > 0 1 : 0 0
[ 0 0 0 5 ] ( A ) - 1 -
0 2 / 2 1 / 0 3 1 0 : 4 7 : 3 0
F l o w ( l p m ) 1 8 0 . 5
B a c k ( % ) 0 . 0 7
L e a k ( % ) 1 8 . 0 0
L e a k ( l p m ) 4 0 . 8
S p e e d ( L O < > H I )
S a m p l e T i m e - > 0 2 : 0 0
[ 0 0 0 5 ] ( A ) - - 2
8. When in the automatic mode, measurements are automatically
saved. These saved measurements along with their associated Test
IDs can be downloaded to a personal computer at a later time for
analysis. Refer to Section 3.16 Importing Saved Data into a
Spreadsheet.