User’s Guide116
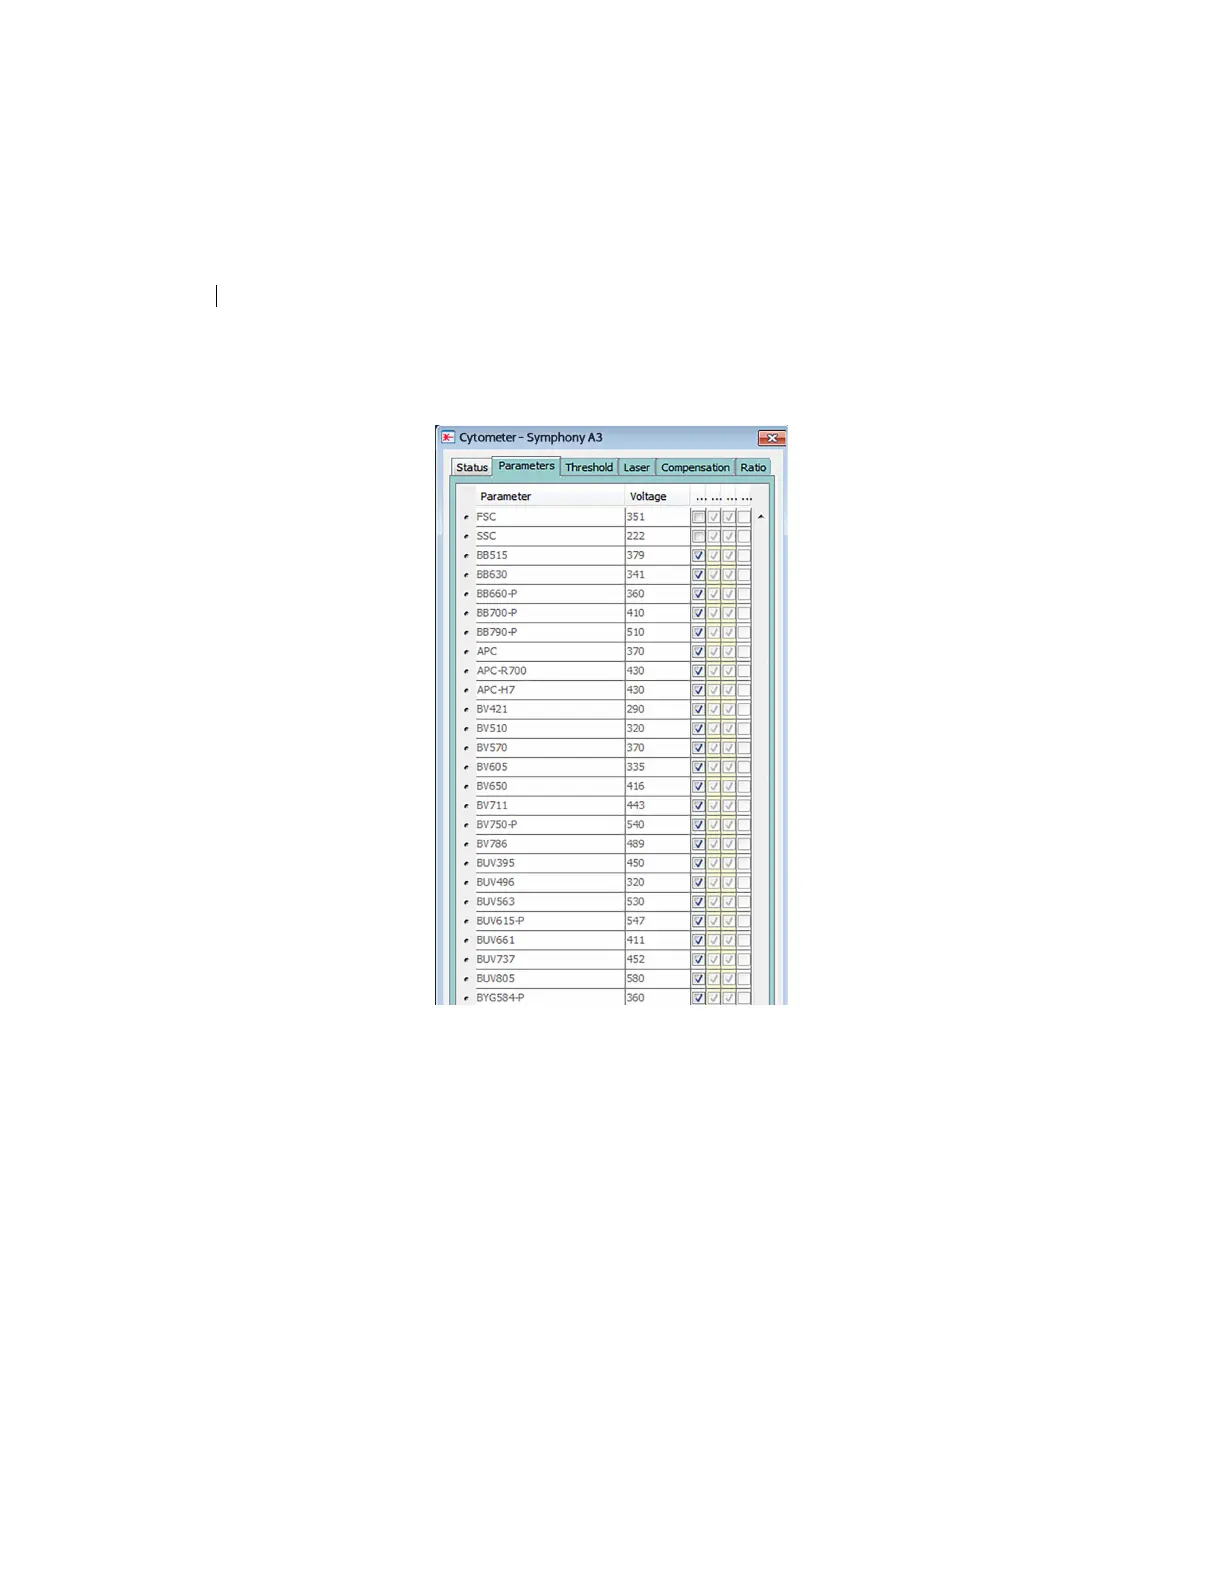
3. In the Inspector, click the Parameters tab and select the H
checkbox to select the height for each parameter.
4. On the global worksheet, create the following plots and
histograms:
• FSC vs SSC dot plot
•
FSC-H and FSC-A histogram
• FITC-H and FITC-A histogram
• APC-H and APC-A histogram
5. Create a P1 gate in the FSC vs SSC plot, and show only the P1
p
opulation in all histograms.