Chapter 6: Recording and analyzing data 91
5. While data is being acquired:
a. Draw a gate around the singlets on the FSC vs SSC plot.
b. Rename the P1 gate to Singlets.
c. Use the Ins
pector to set the other plots to show only the
singlet population by selecting the Singlets checkbox.
6. Click Record Data.
7. When event recording has completed
, remove the first tube
from the cytometer.
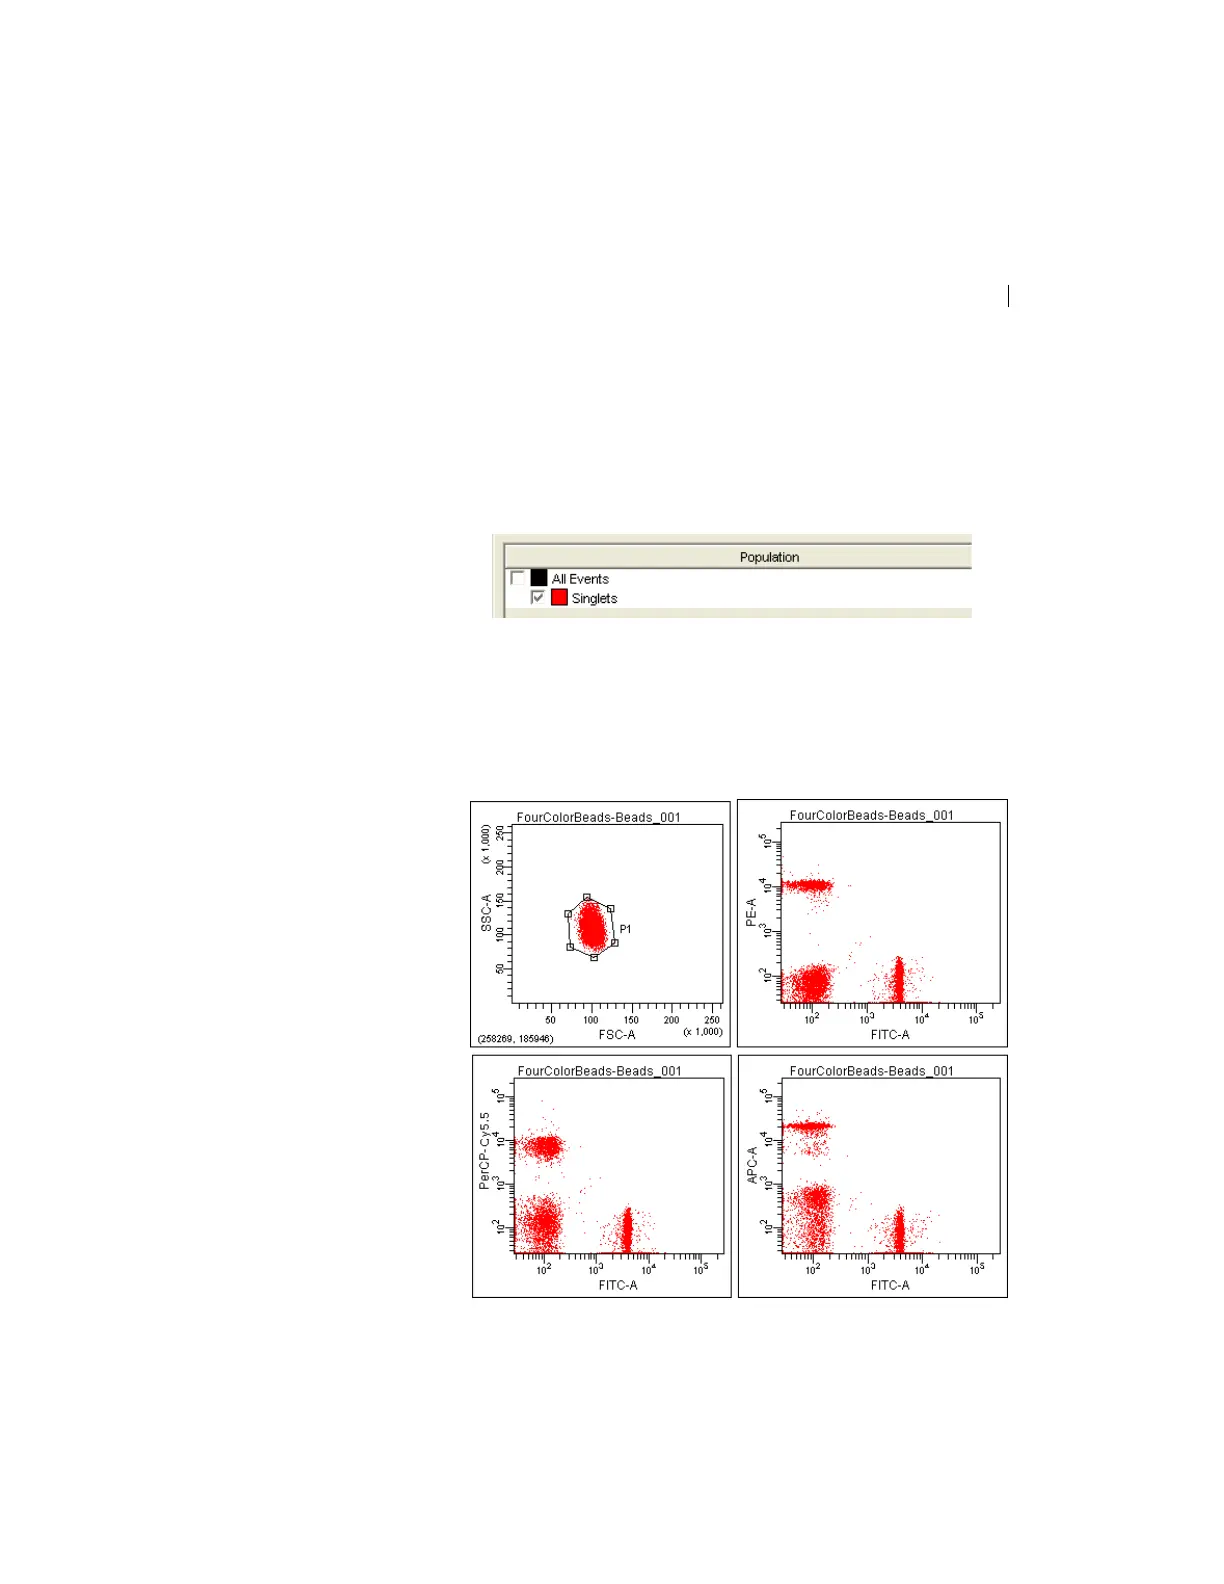
The MyData w
orksheet plots should look like the following.