M (E2) 04/2019 page 22/71
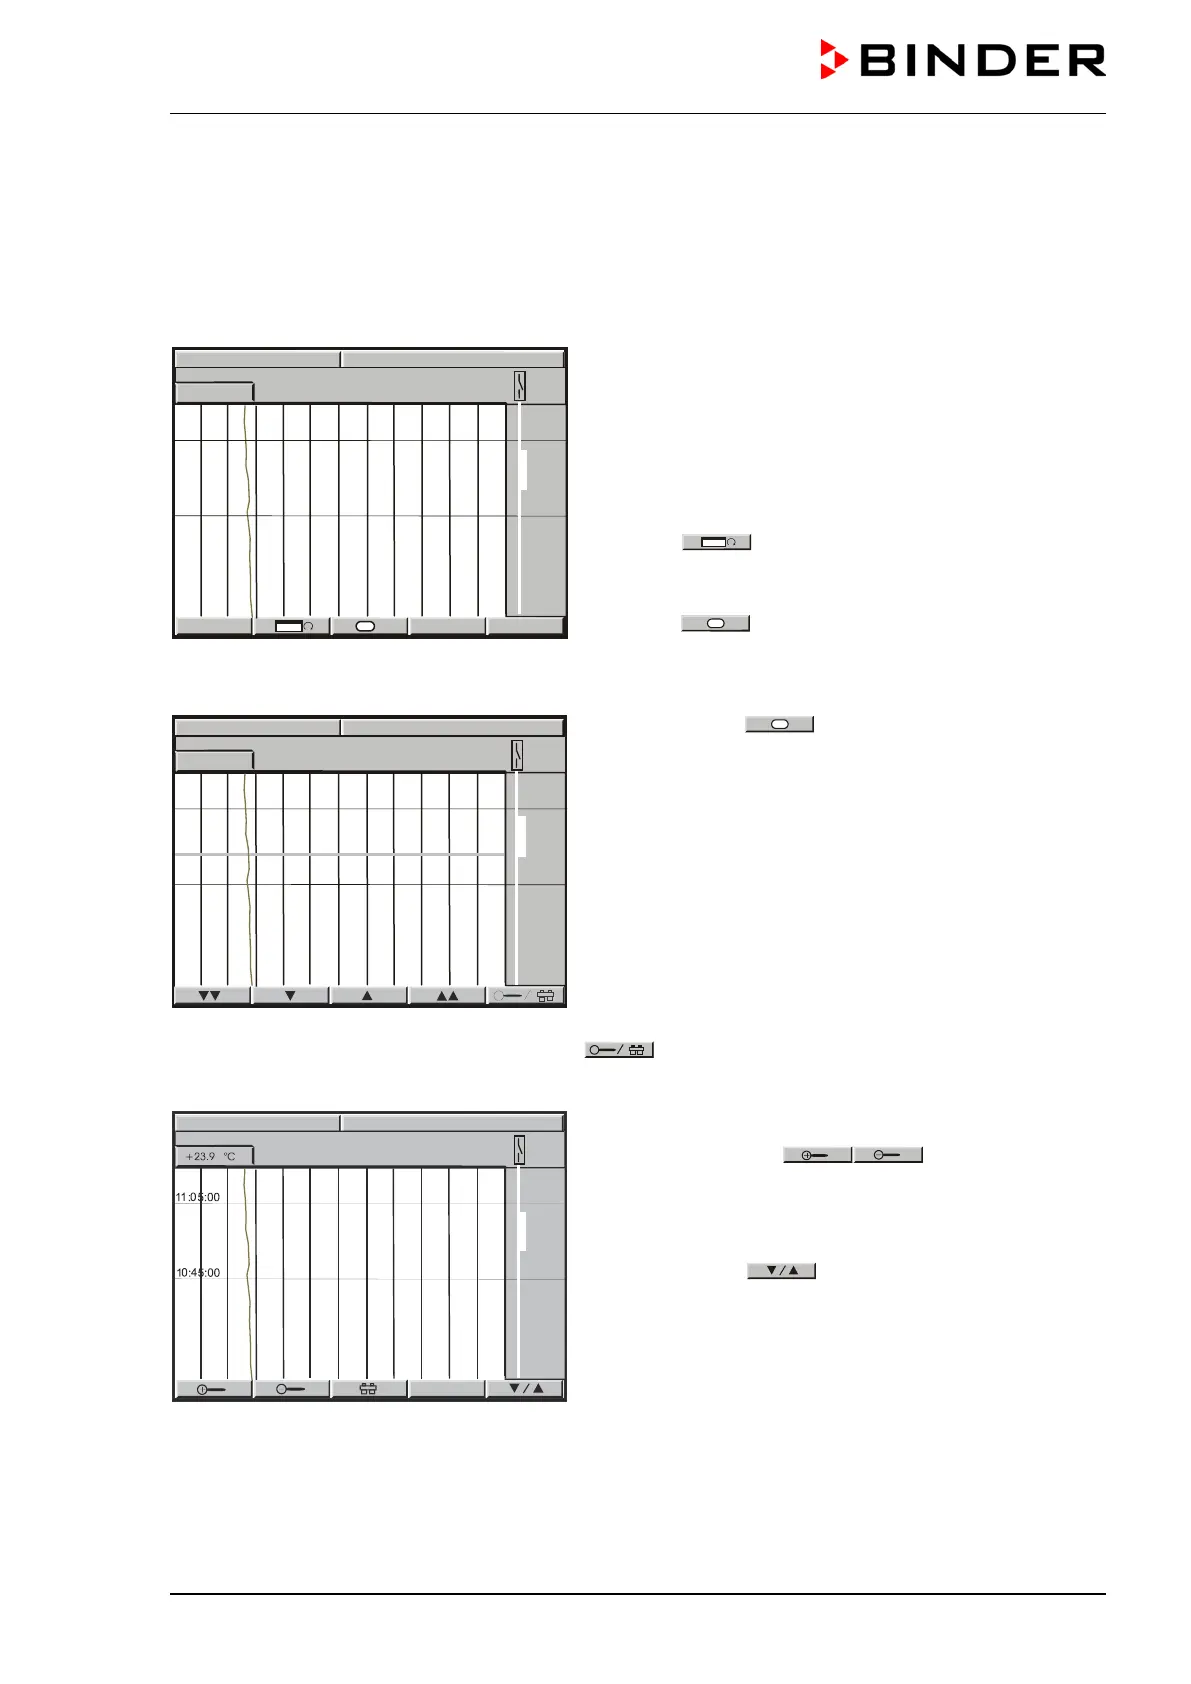
7. Graphic representation of the historical measurement (chart
recorder function)
The representation of data imitates a chart recorder and allows recalling any set of measured data at any
point of time taken from the recorded period.
Normal display of the chart recorder function:
Top left: The actual date and time are displayed.
Below: The current temperature value [ °C] is numeri-
cally and graphically displayed.
Scaling of temperature: 0 °C to 300 °C.
The open air flap is displayed on the right side as
thick line.
Button
allows toggling between different rep-
resentations.
Depending on the selected kind of represen
button
might not have been visible
procedure.
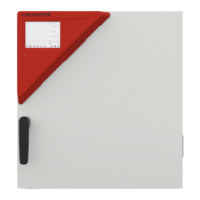
History display with cursor:
Select button
= History. A pink line appears
on the display marking as a cursor the selected mo-
ment. You can now recall the recorded data of any
defined moment.
Top left: Date and time of the selected cursor position
are displayed.
Below: The corresponding temperature value of this
instance is numerically and graphically displayed.
Scroll the cursor position using the arrow buttons.
Single arrow buttons: fine-tuning.
Double arrow buttons: page-up and page-down.
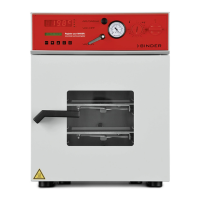
Toggle to the zoom display by pressing button
:
Magnifier buttons
back (i.e., shorten or extend the displayed period).
Toggle back to the former representation display us-
ing this button
.