the same rate as the disk on your utility meter. The faster the Disk Emulator
spins, the greater the rate of energy consumption and the higher the dollars-
per-hour value you will see on the screen. After a few minutes, the second
value on the screen in the third row (Total Row), showing as $0.00 above, will
start increasing and provides the total cost of electricity used.
If your Sensor Unit loses its alignment, possibly as the result of snow or ice
falling on it, it will be apparent if the display shows unusually low
consumption (0.4KWor less) for an extended period of time when you are
performing normal household tasks such as cooking, laundry, or turning on
other appliances.
If, after a few minutes the value displayed is still dashes and the Disk
Emulator has not started spinning it is possible that the Display Unit is out of
range of the Sensor Unit. Try moving the Display Unit closer to the Sensor
Unit. If this does not work, then you should check the alignment of the Sensor
Unit and you may need to resynchronize your PowerCost Monitor system. To
do this, refer Section 5.7 –
Synchronizing the Display and Sensor Units.
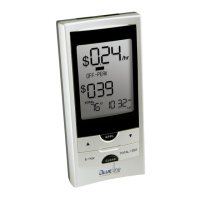
6.2. Dollar & Cents Display Mode
The first screen you will see once the PowerCost Monitor starts functioning
will be similar to the one depicted in figure 6.3, below. The top row (Demand
Row) on the screen shows how much electricity you are currently consuming
in dollars and cents. In this example you are currently using $1.08/hour worth
of electricity.
 Loading...