6.1.
The diagrams on the following pages explain each screen and the features that
are displayed.
Start-up
Once the Sensor Unit begins to detect power usage from your utility meter the
Display Unit inside will automatically start showing information after a short
time. A typical display is shown in figure 6.2, below. The actual numbers
displayed will vary depending on the amount of electricity you are using at the
time.
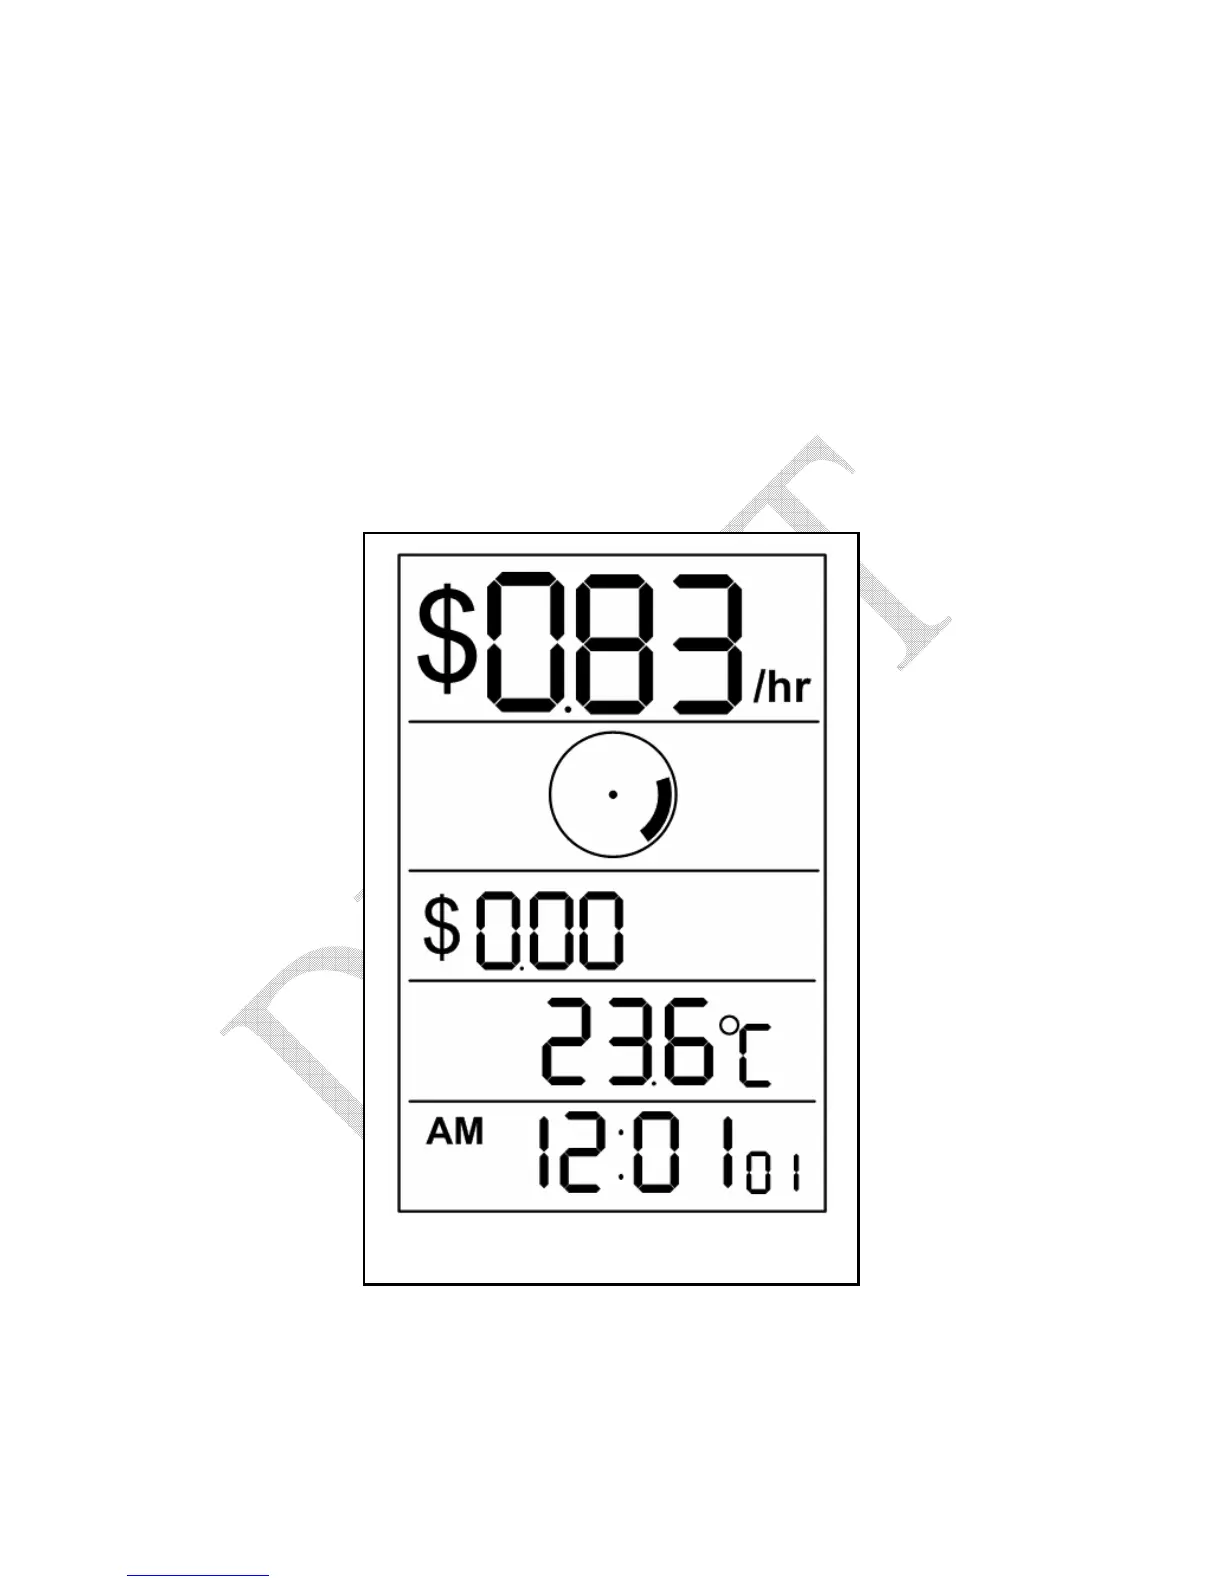
Figure 6.2 – Typical Display
At first, you will see a screen showing dashes. After a short delay, the screen
will show the current cost of electricity in dollars-per-hour in the top row
(Demand Row). The screen above shows the current cost as $0.83/hour (your
actual amount shown will vary). The Disk Emulator spins at approximately
 Loading...