Model 621 User’s Manual USING THE LASER WAVELENGTH METER
Bristol Instruments, Inc. 19
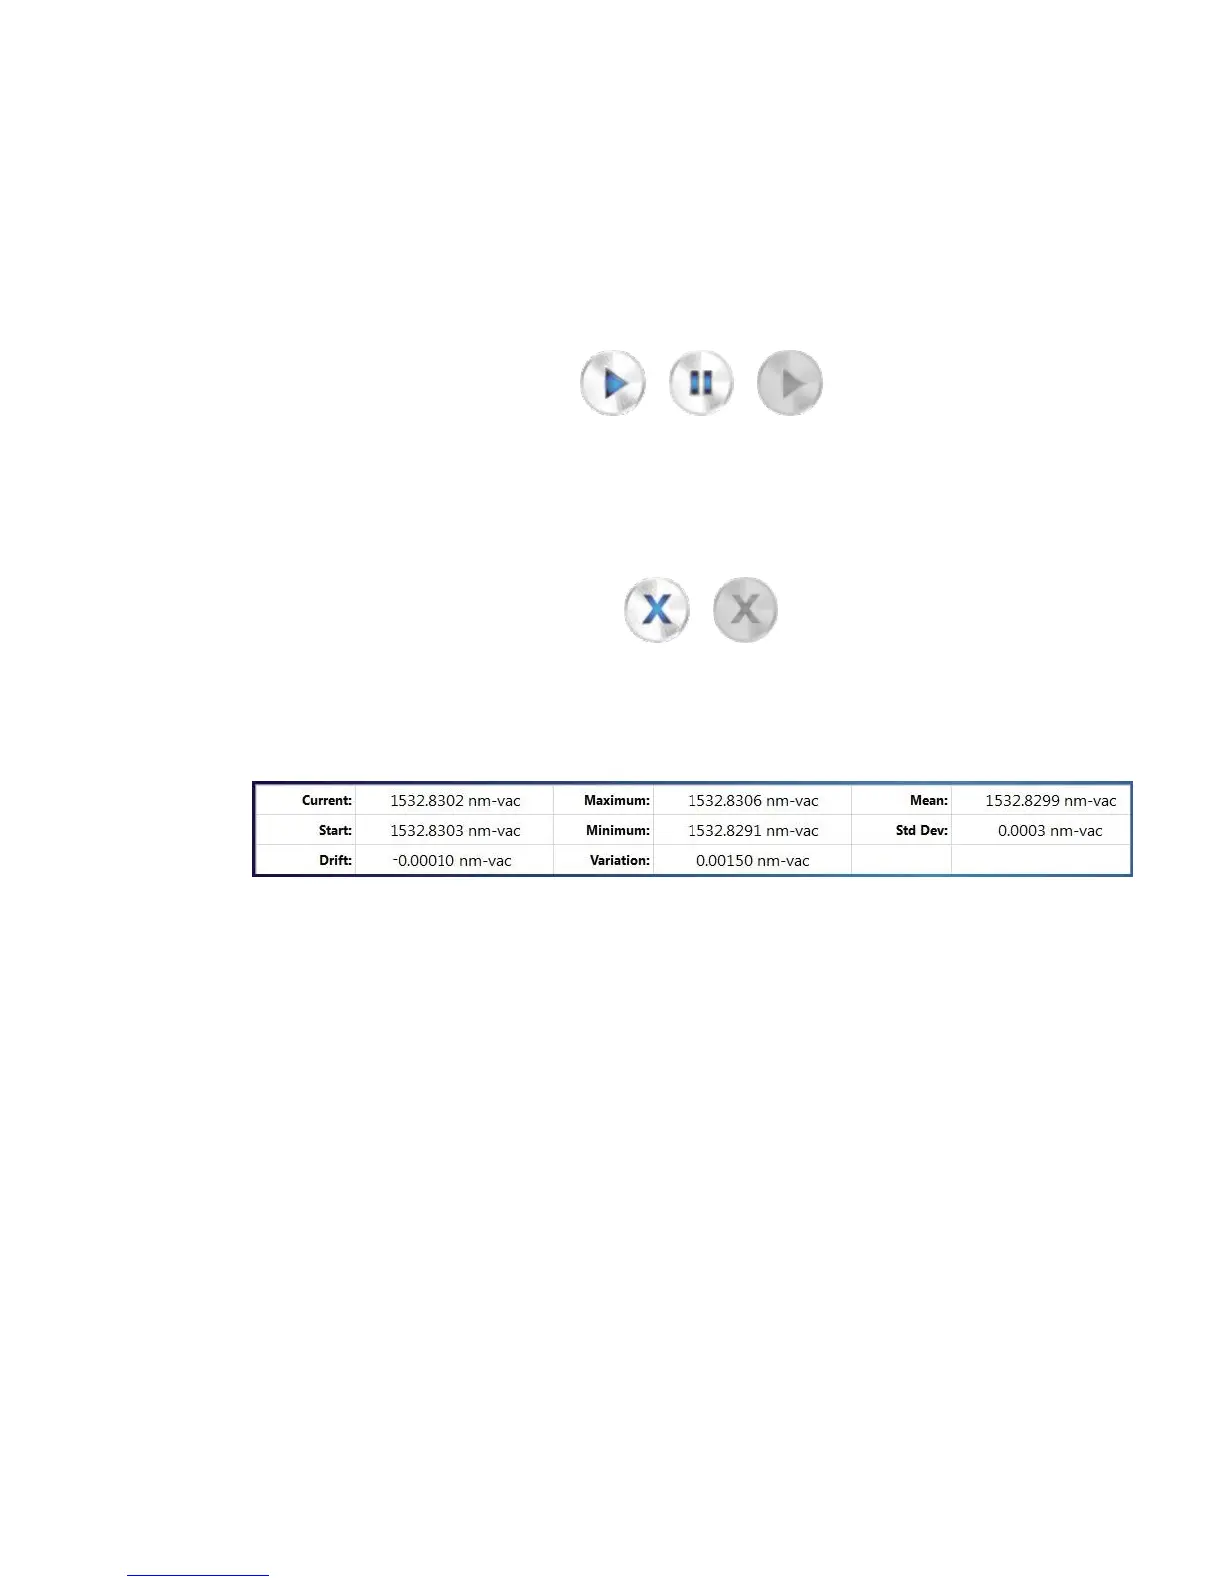
Measure/Pause
Selecting the Measure button (left) initiates data collection. After the Measure
button is selected, it changes its appearance to the Pause button (middle). The
Trend Graph and Data Table are updated continuously until the Pause button is
selected. Selecting the Pause button stops data collection, and the Trend Graph
and Data Table display the last measured data. When the instrument is not
connected, the Measure button changes its appearance to its greyed-out inactive
state (right).
Clear
Selecting the Clear button (left) restarts the Trend Graph and resets the values in
the Data Table. When the instrument is not connected, the Clear button changes
its appearance to its greyed-out inactive state (right).
Data Table
The Data Table provides current and trending information about the laser’s
wavelength, frequency or wavenumber.
The first column of the Data Table provides laser drift information. This column
displays the current measurement (Current), the first measurement taken after
the Trend Graph is started/reset (Start), and the difference between the Current
and Start measurements (Drift).
The second column provides the total measured variation of the laser under test.
This column displays the maximum and minimum measurements recorded on
the Trend Graph (Maximum and Minimum, respectively), and computes the
difference between them (Variation).
The third column provides some basic statistical information about the variation
of the Trend Graph. This column provides the average (Mean) and standard
deviation (Std Dev) of the Trend Graph.