BTU VENTILATION CORPORATION ● OFFICE 888-884-8070 ● FAX 218-346-7485 ●
www.btucorp.com
XT-70 Control Panel 76
Excel Graphs & Templates:
The main part of the template is to get the data to load into the records page. The trick is that the exact
number of records is unknown. Thus when the graphs are set up, they have to be inclusive of just the
data. The BTU template can easily be modified it for a specific application.
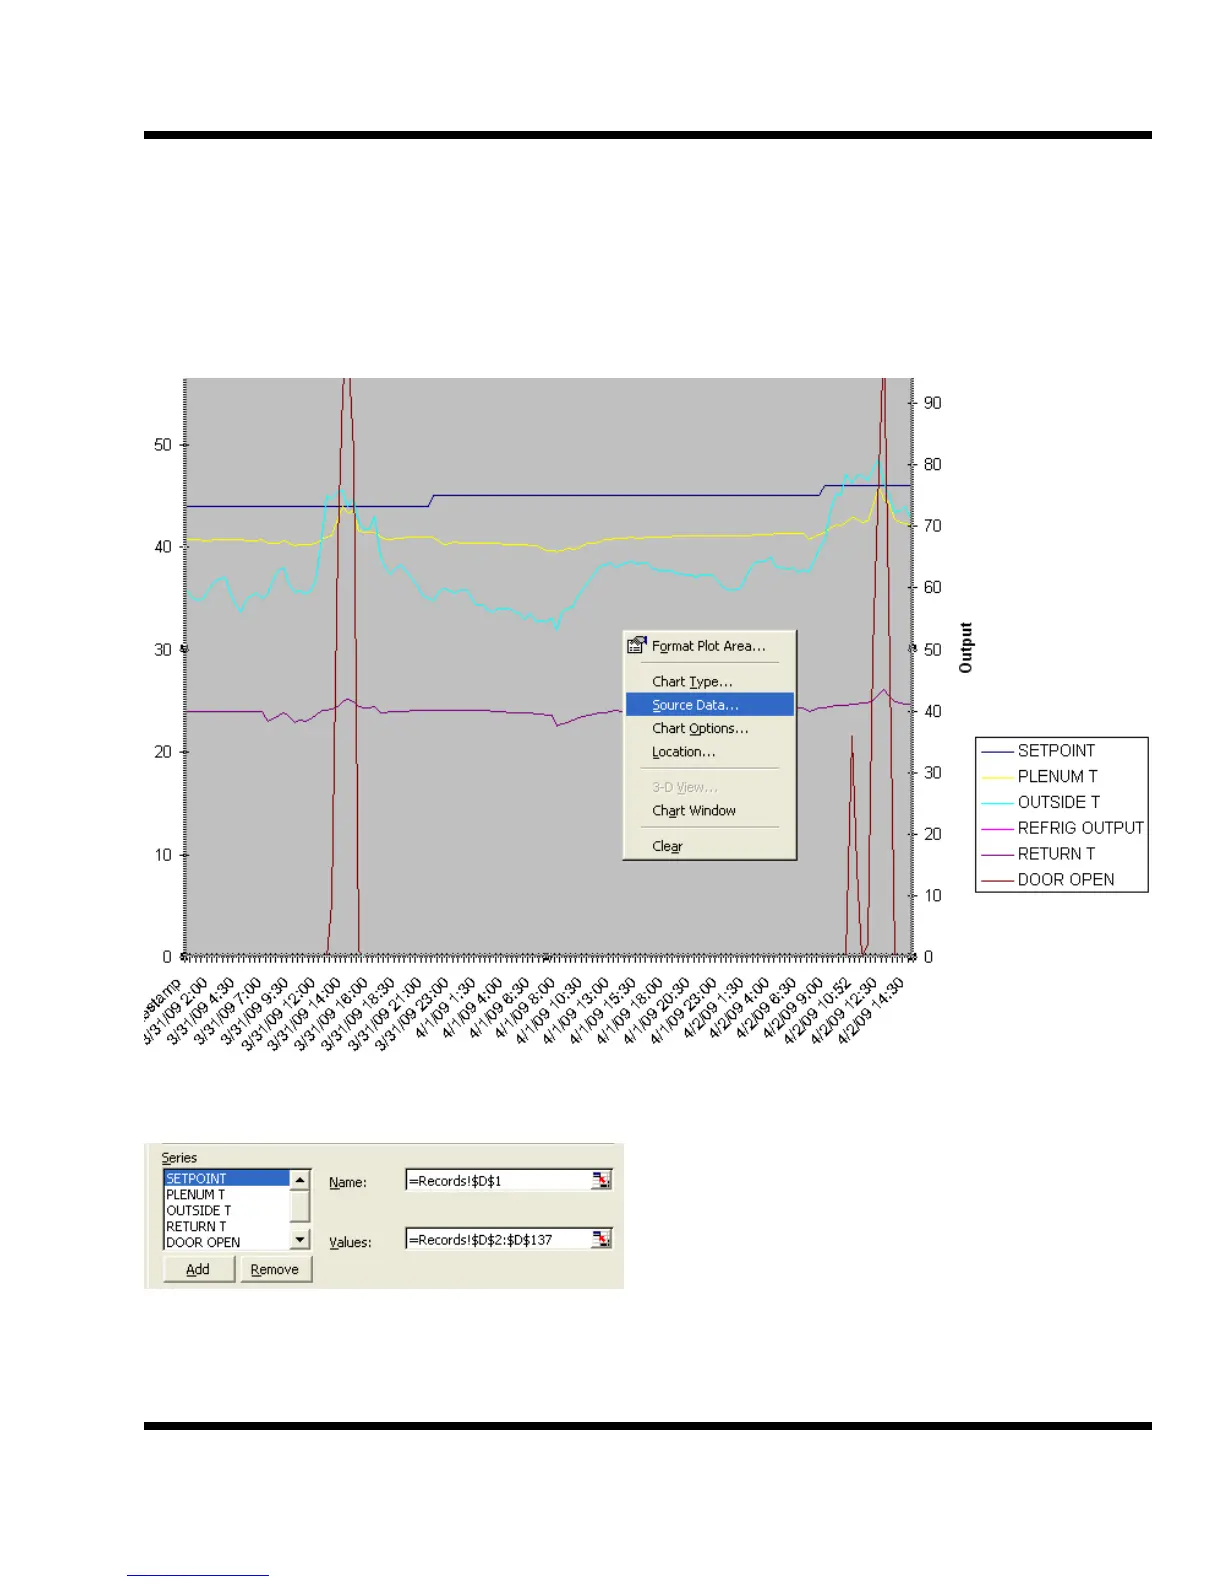
Chart 1 is a dual axis graph and has temperatures on the left side and output percentage on the right
side.
To make a change to the parameters being graphed, right click on the graph and select Source Data.
Remove parameters by clicking on the parameter and then Remove. To change a parameter, select the
parameter, determine which column the needed
parameter is in and then change the alpha char-
acter in both the Name and Values boxes.
To add a button, click on Add. Then go to one of
the other sensors and copy the Name string and
paste it in to the new one and change the alpha
character to match the desired value. Repeat for
the Values field.