Measurement Result Graph
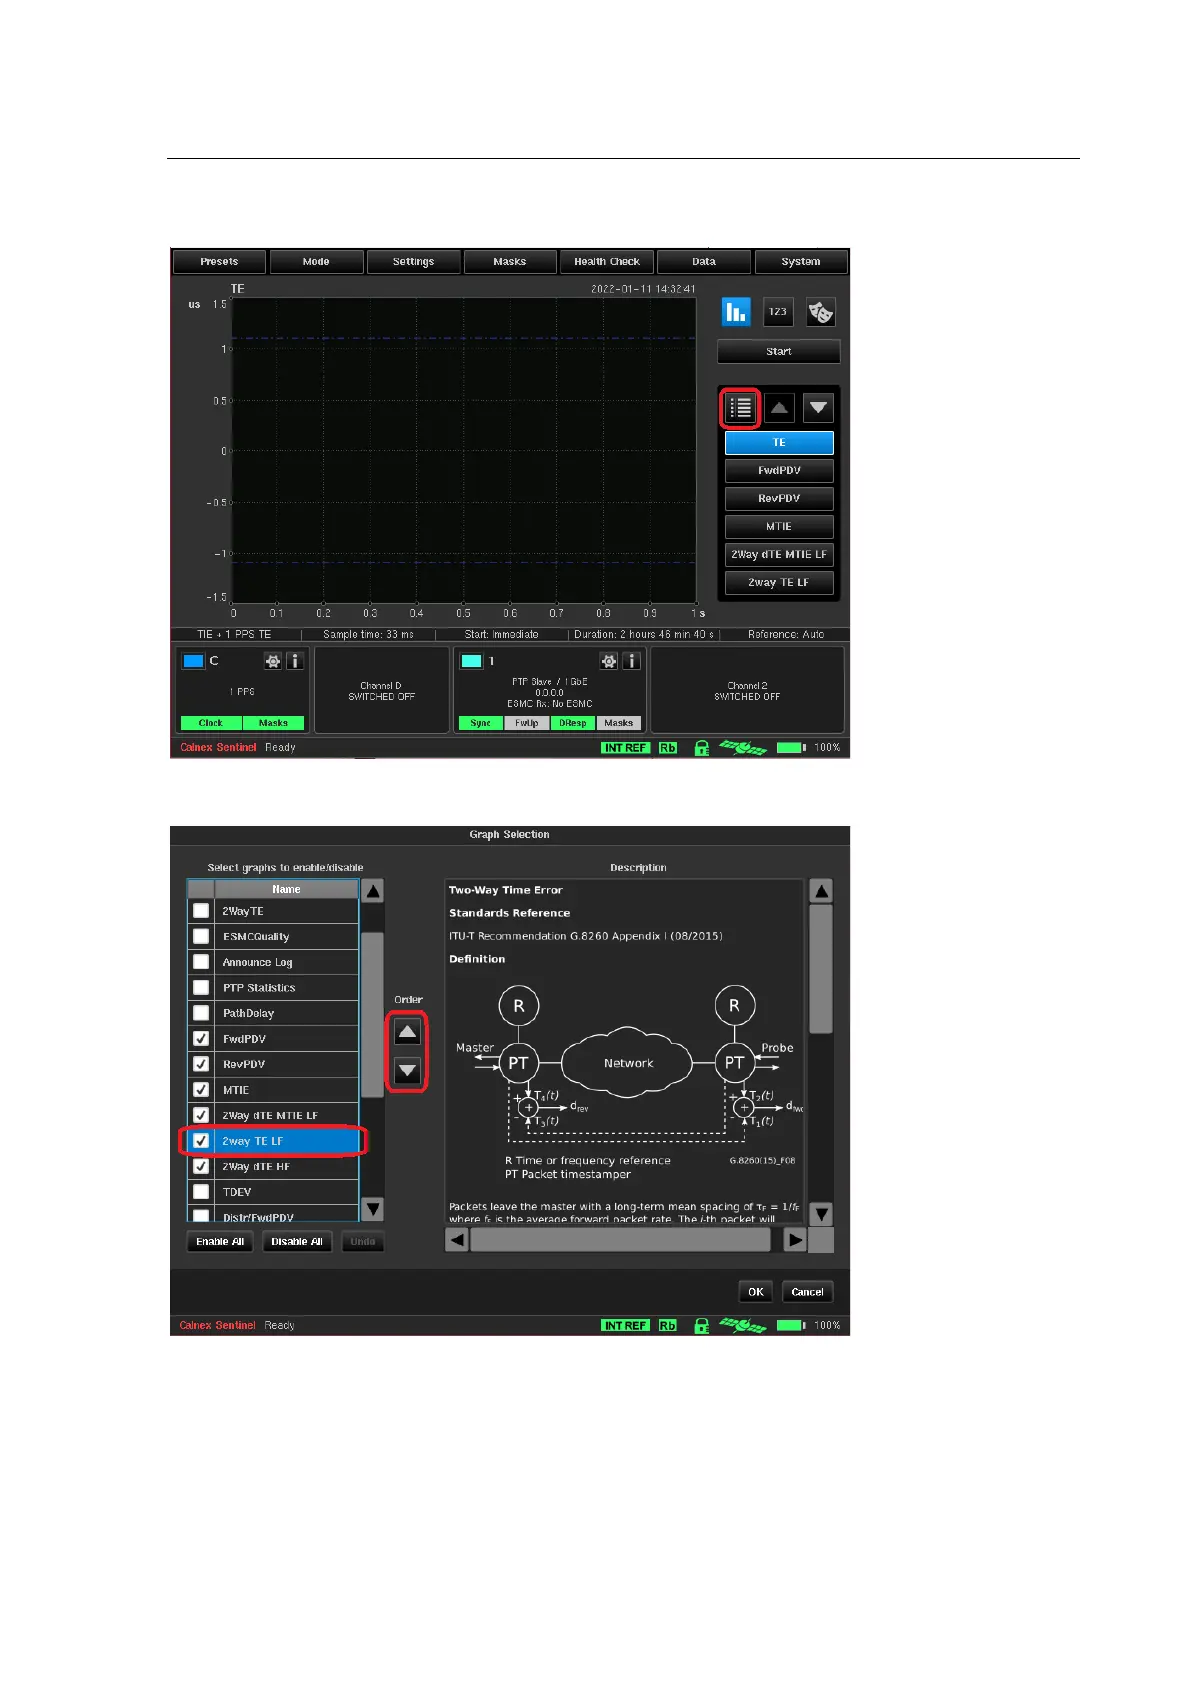
Sentinel creates a graph for every measurement and its associated metrics. The graphs that are displayed and
the order that they appear in the navigation panel can be configured by pressing the graph selection button
highlighted below.
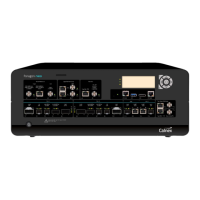
A Hide / Show checkbox and associated measurement description is available for each graph. Graph ordering can
be changed by highlighting the graph name and pressing the Order arrow buttons.
The measurements made remain displayed on the screen until a new measurement sequence is started by
pressing the Start/Stop button.
The following metrics are calculated from the measurement results.