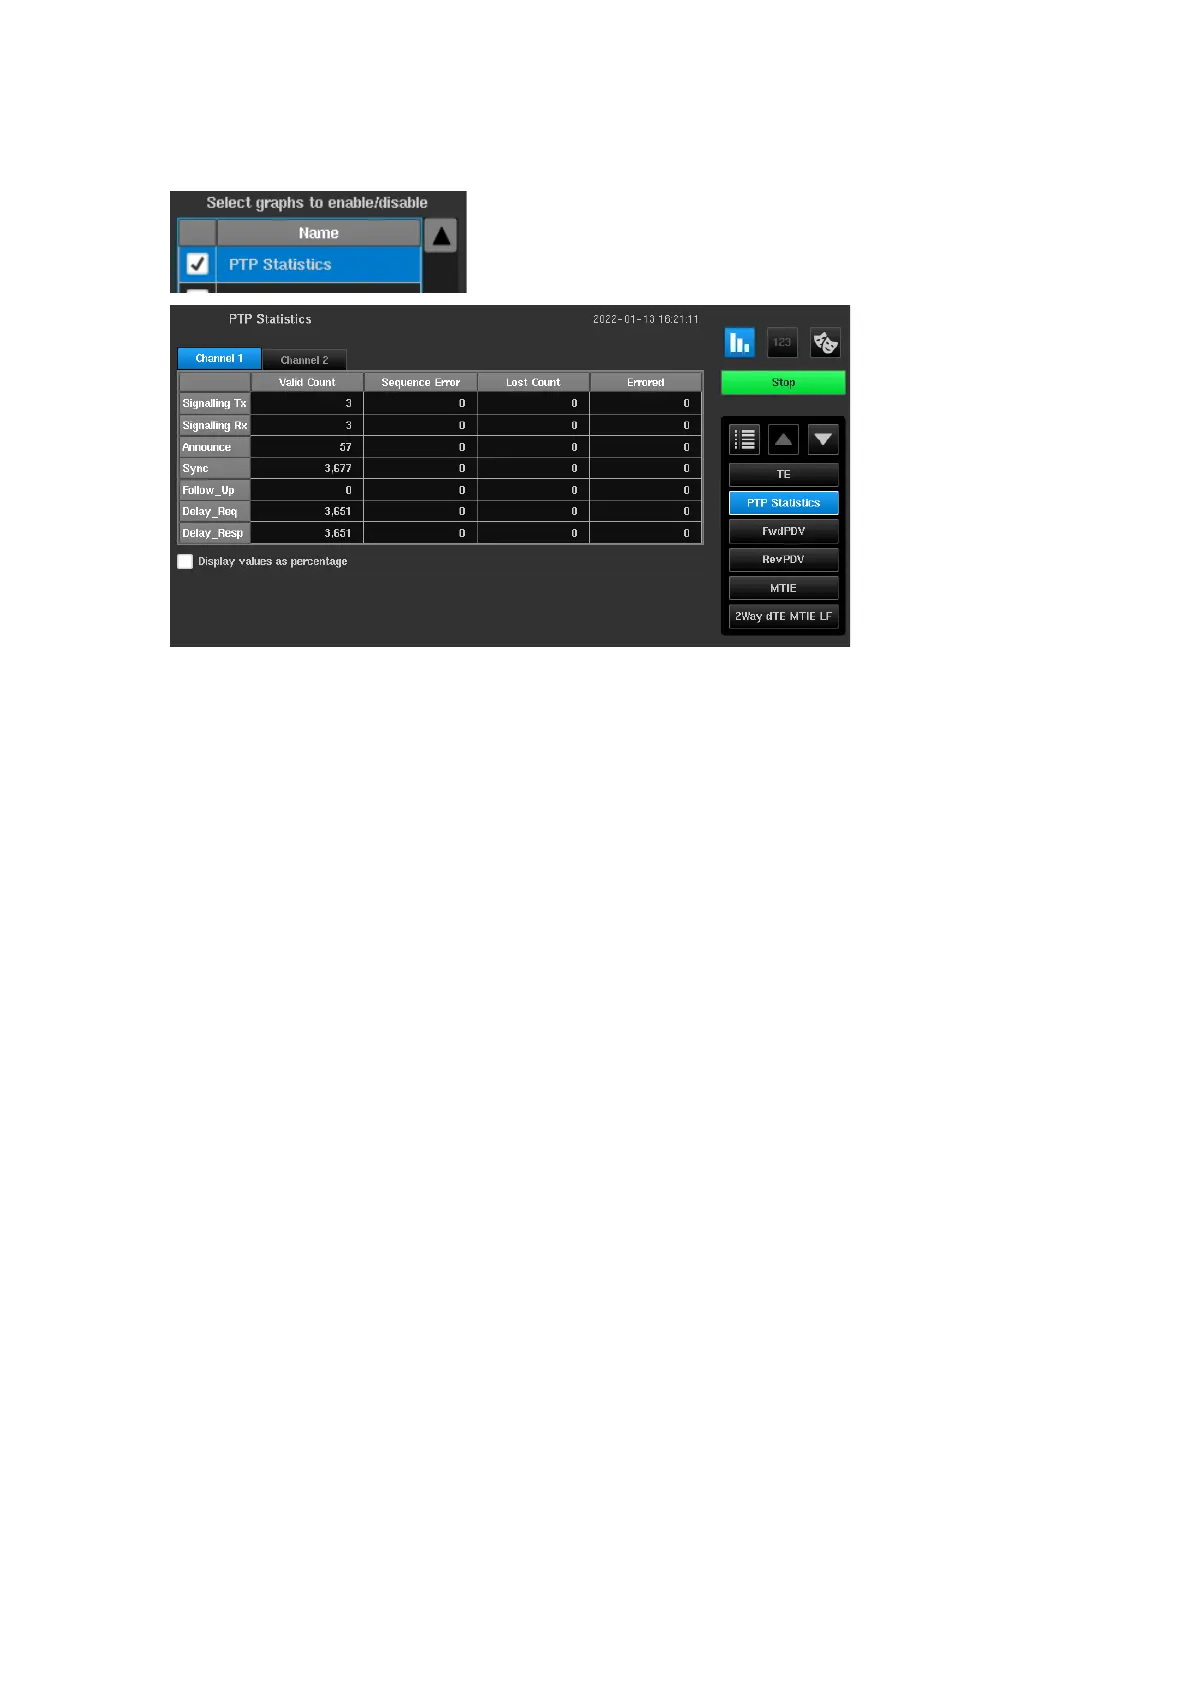
Metric for PTP Statistics
If a PDV measurement has taken place then statistics of the PTP packets used in the measurement can be
displayed by selecting to show the PTP Statistics metric on the Graph Selection page.
Statistics are held separately for each PTP card and are selected by the Channel
x
tabs at the top of the table.
Columns indicate the number of PTP packets received that had a PTP sequence error, lost PTP packets or errored
PTP packets.
Statistics can also be displayed as a percentage rather than an absolute count.
The rows indicate the different types of PTP packets. Results are stored in .csv format to a file named
ptp_measurement_statistics.sentinel
in the folder specified when the measurement was started.
Note: In pseudo slave mode Signalling Tx and Delay_Req messages originate from Sentinel and all others from
the GM.
Note: In monitor mode all packets are received from the TAP or splitter and so the messages from the GM will
show up on one channel and the messages from the T-TSC on the other. All signalling will appear in the
Signalling Rx row. Signalling from the GM will be on the channel that has Sync messages and signalling
from the T-TSC will be on the other channel.
 Loading...