102
Chapter 7 Statistical Graphs and Calculations
2. Use the function key menu to select the name of the statistical data list whose
values you want on the
x-axis of the graph.
1 (List1) ....... List 1
2 (List2) ....... List 2
3 (List3) ....... List 3
4 (List4) ....... List 4
[
1 (List5) ....... List 5
2 (List6) ....... List 6
Press [ to return to the previous menu.
uu
uu
uTo select the y-axis data list (YList)
1. While the graph settings screen is on the display, use f and c to move the
highlighting to the YList item.
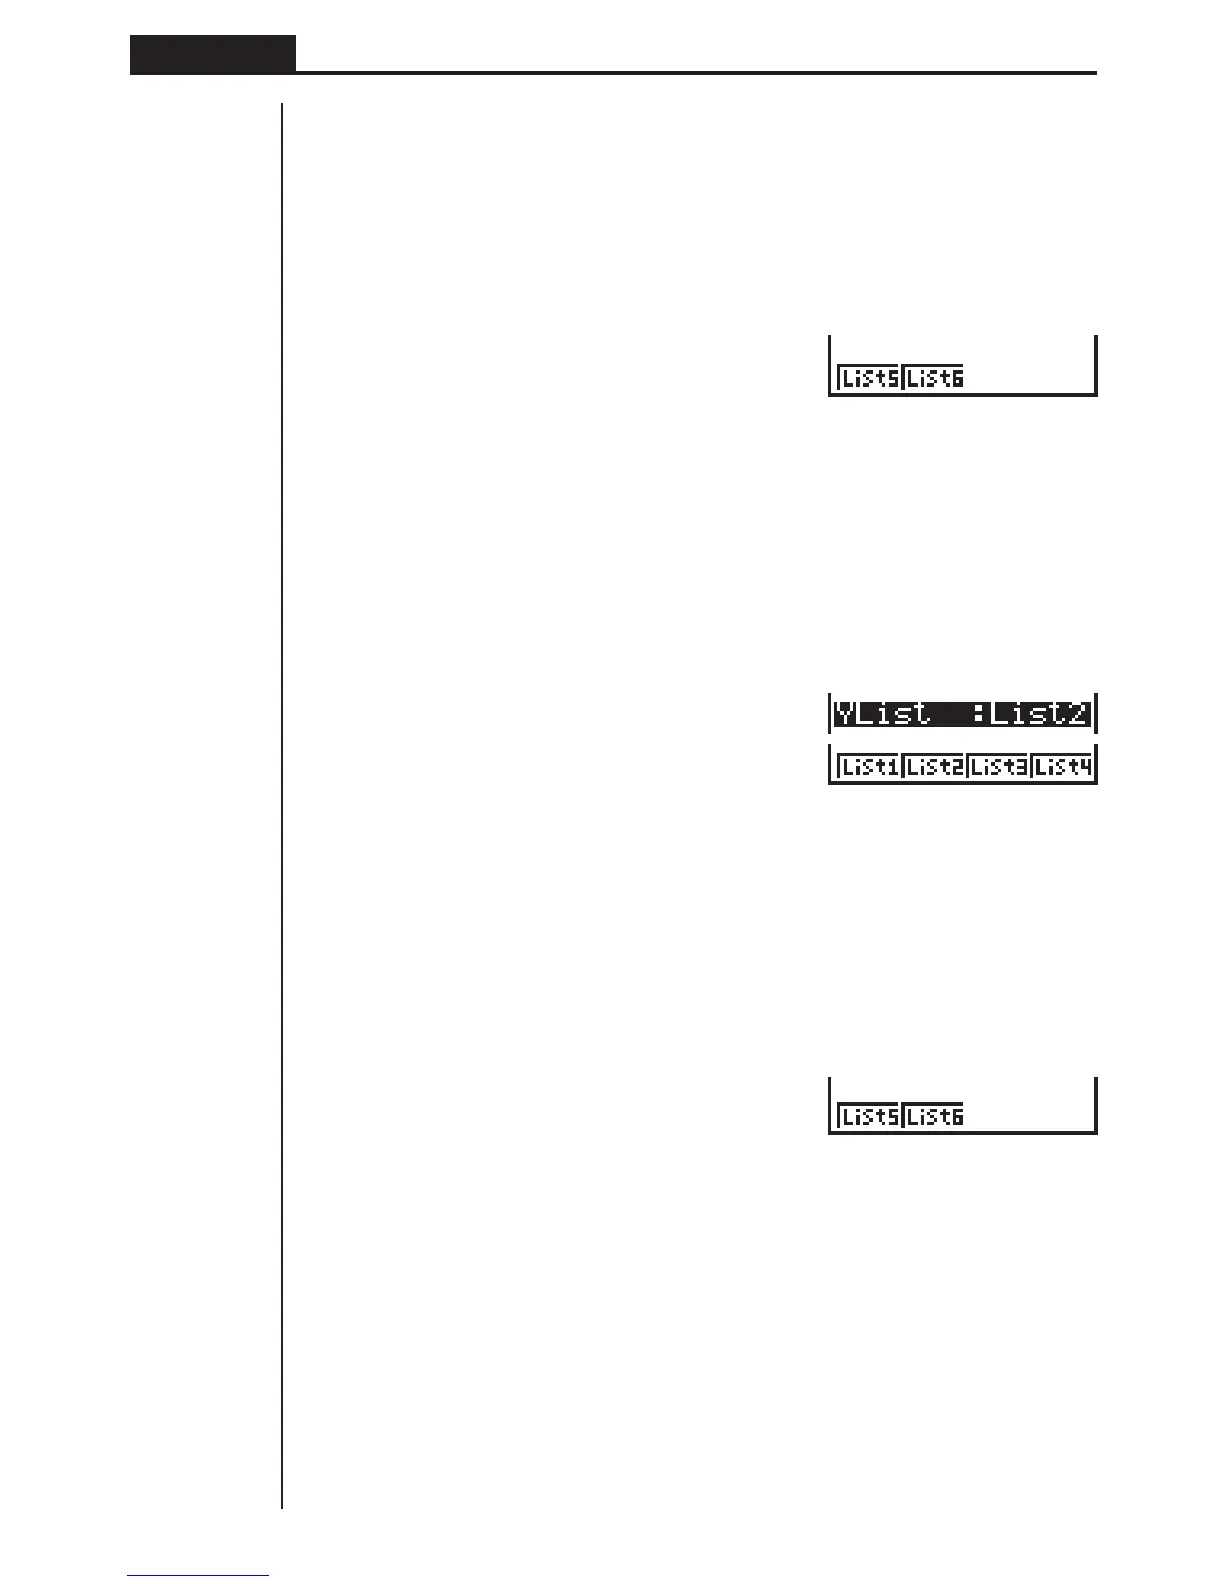
2. Use the function key menu to select the name of the statistical data list whose
values you want on the
y-axis of the graph.
1 (List1) ....... List 1
2 (List2) ....... List 2
3 (List3) ....... List 3
4 (List4) ....... List 4
[
1 (List5) ....... List 5
2 (List6) ....... List 6
Press [ to return to the previous menu.
1234[
1 2 3 4 [
1234[