103
Statistical Graphs and Calculations Chapter 7
uu
uu
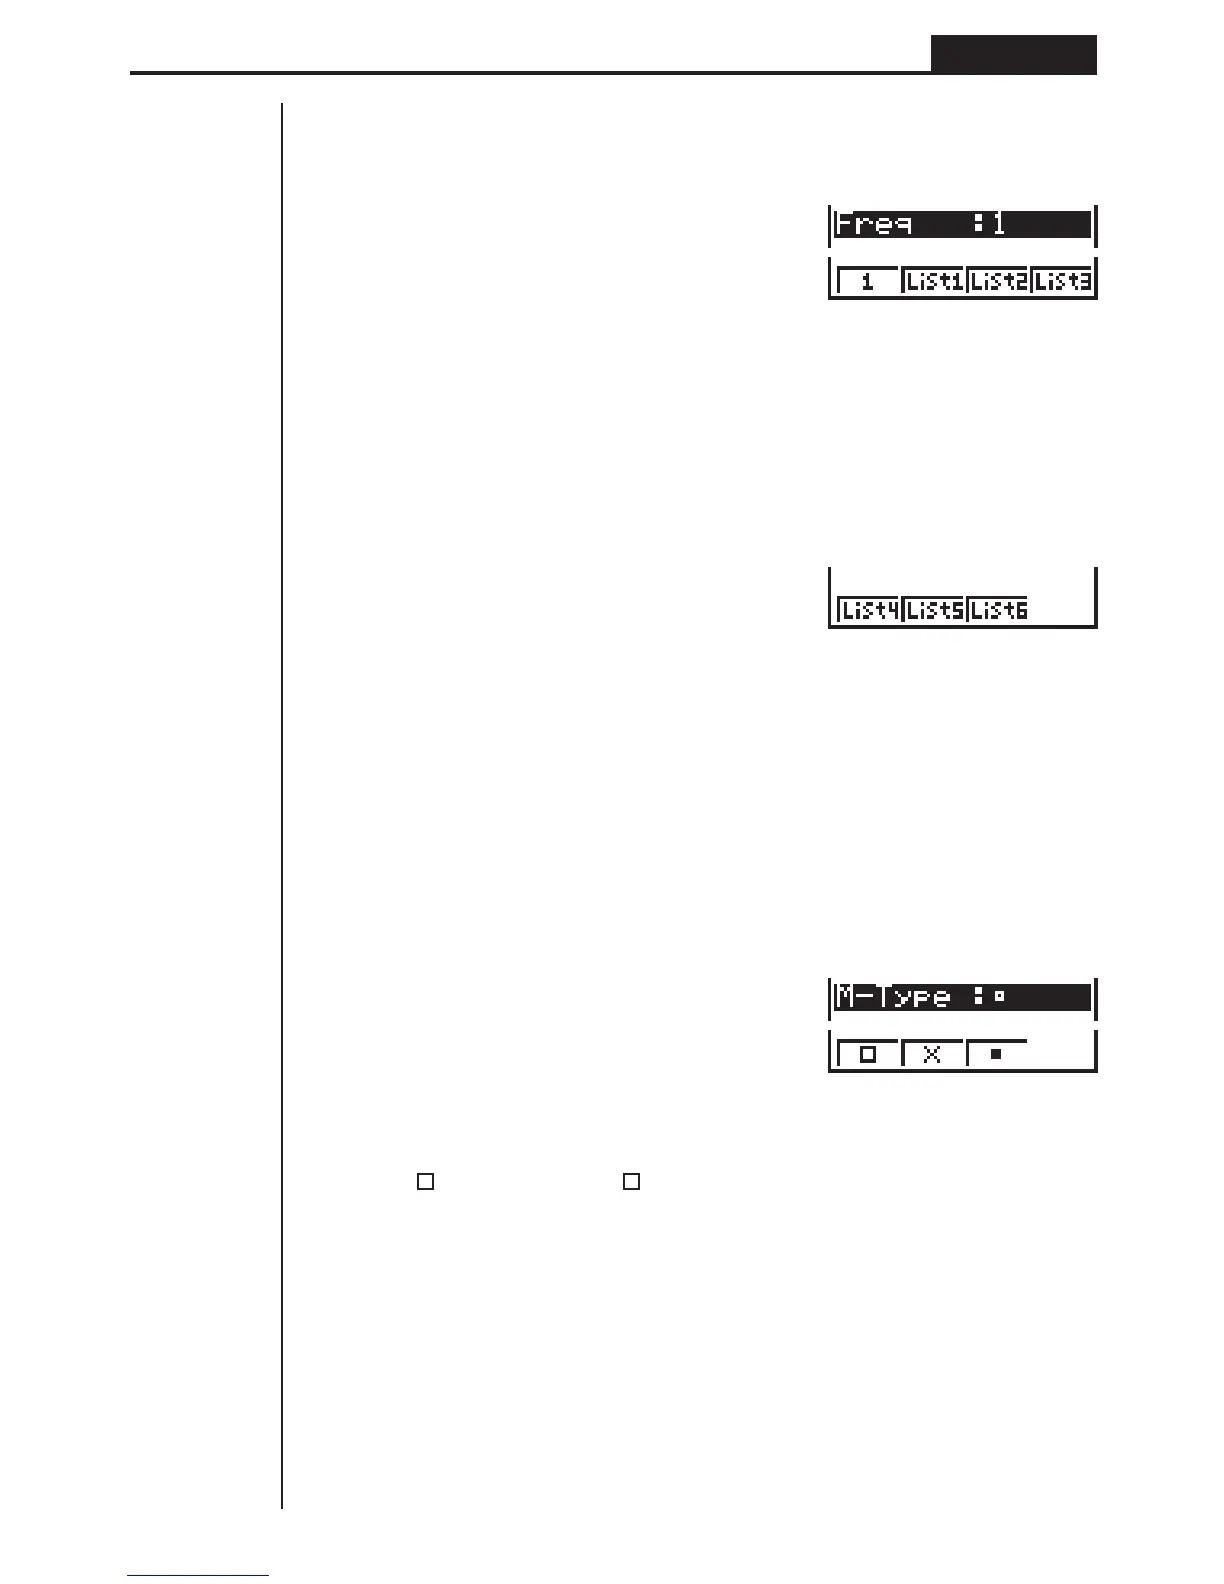
uTo select the frequency data list (Freq)
1. While the general graph settings screen is on the display, use f and c to
move the highlighting to the Freq item.
2. Use the function key menu to select the frequency setting you want.
1 (1) ............. Plot all data (1-to-1)
2 (List1) ....... List 1 data is frequency data.
3 (List2) ....... List 2 data is frequency data.
4 (List3) ....... List 3 data is frequency data.
[
1 (List4) ....... List 4 data is frequency data.
2 (List5) ....... List 5 data is frequency data.
3 (List6) ....... List 6 data is frequency data.
Press [ to return to the previous menu.
uu
uu
uTo select the plot mark type (M-Type)
1. While the general graph settings screen is on the display, use f and c to
move the highlighting to the M-Type item.
2. Use the function key menu to select the plot mark you want to select.
1 (
) ............ Plot using
2 (X) ............ Plot using X
3 (•).............. Plot using •
1234
1 2 3 4 [
1 2 3 4 [