67
Graphing Chapter 4
In the RUN or PRGM Mode
The following is the syntax for plotting points in these modes.
Plot <
x-coordinate>, <y-coordinate>
Example To plot a point at (2, 2)
Use the following View Window parameters.
Xmin = –5 Ymin = –10
Xmax = 5 Ymax = 10
Xscl = 1 Yscl = 2
1. After entering the RUN Mode, display the sketch menu and perform the following
operation.
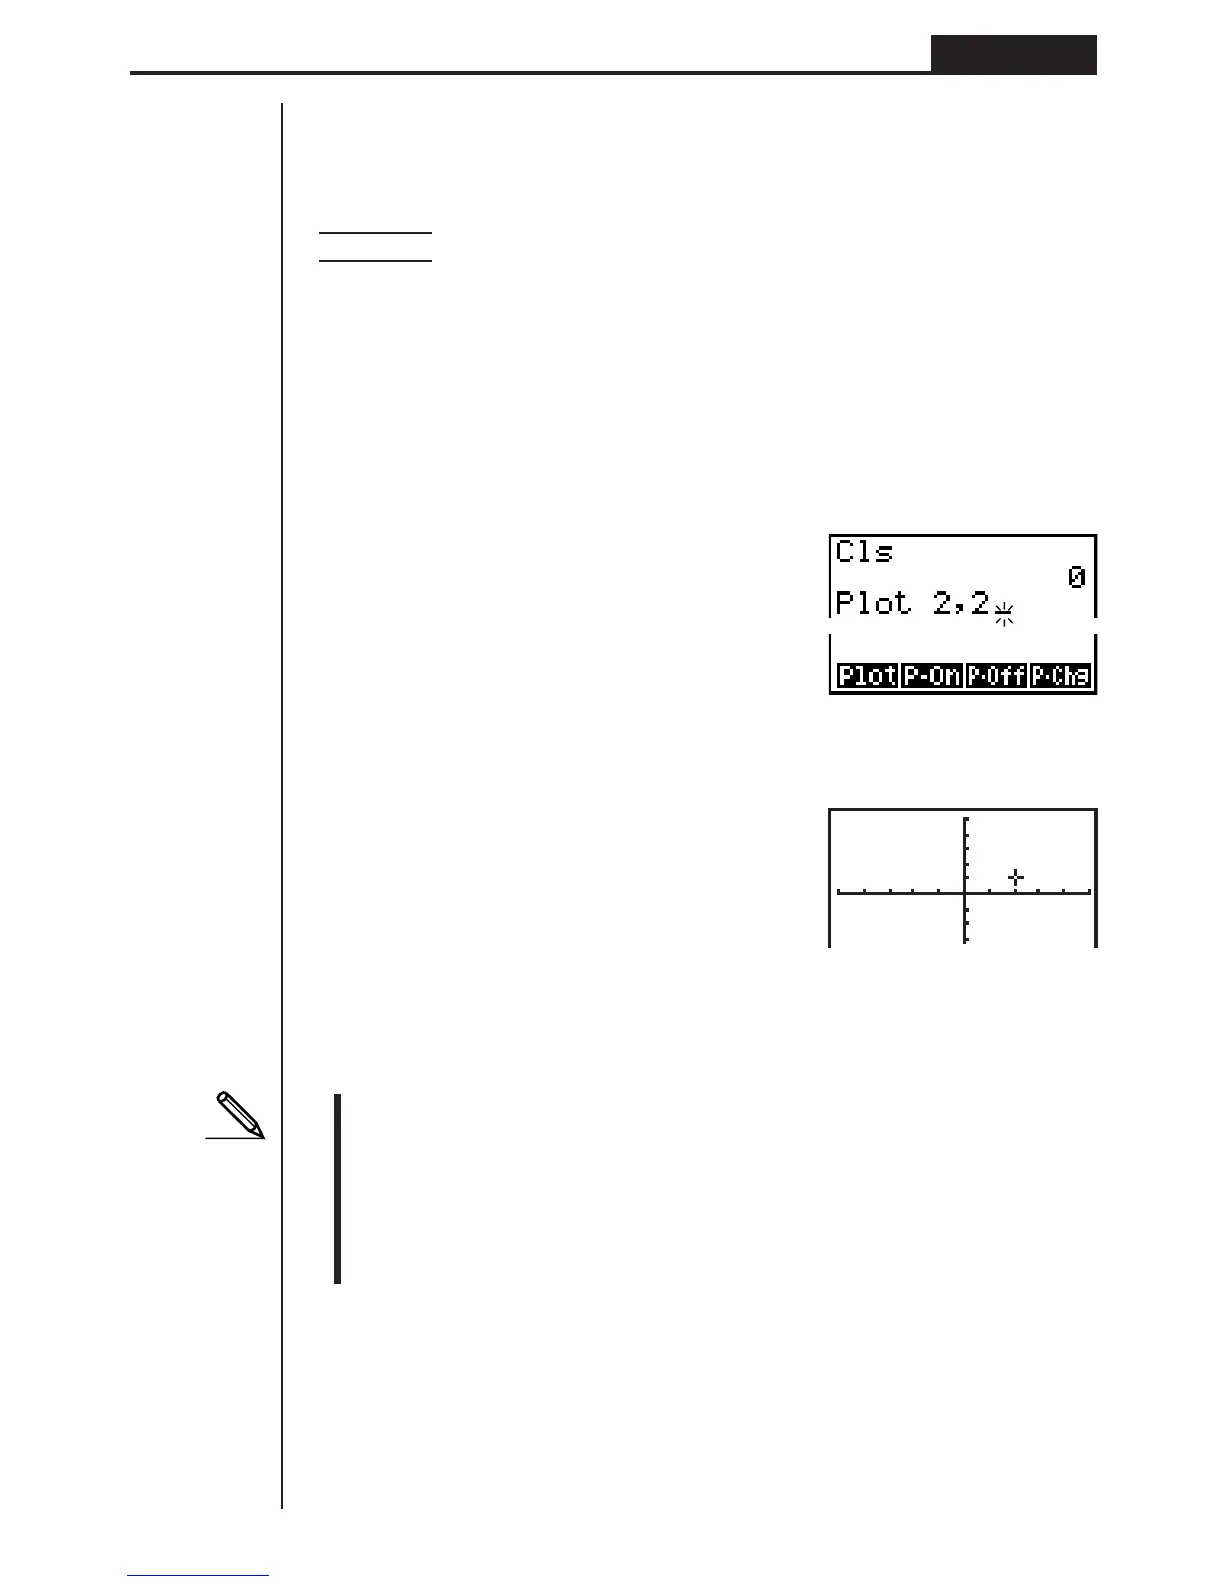
!4(SKTCH)1(Cls)w
3(PLOT)1(Plot)c,c
2. Press w.
ww
•You can use the cursor keys (f, c, d, e) to move the pointer around the
screen.
• If you do not specify coordinates, the pointer is located in the center of the
graph screen when it appears on the display.
• If the coordinates you specify are outside the range of the View Window param-
eters, the pointer will not be on the graph screen when it appears on the dis-
play.
•The current
x- and y-coordinate values are assigned respectively to variables X
and Y.