70
Chapter 4 Graphing
uu
uu
uTo draw a line in the STAT, GRAPH and TABLE Modes
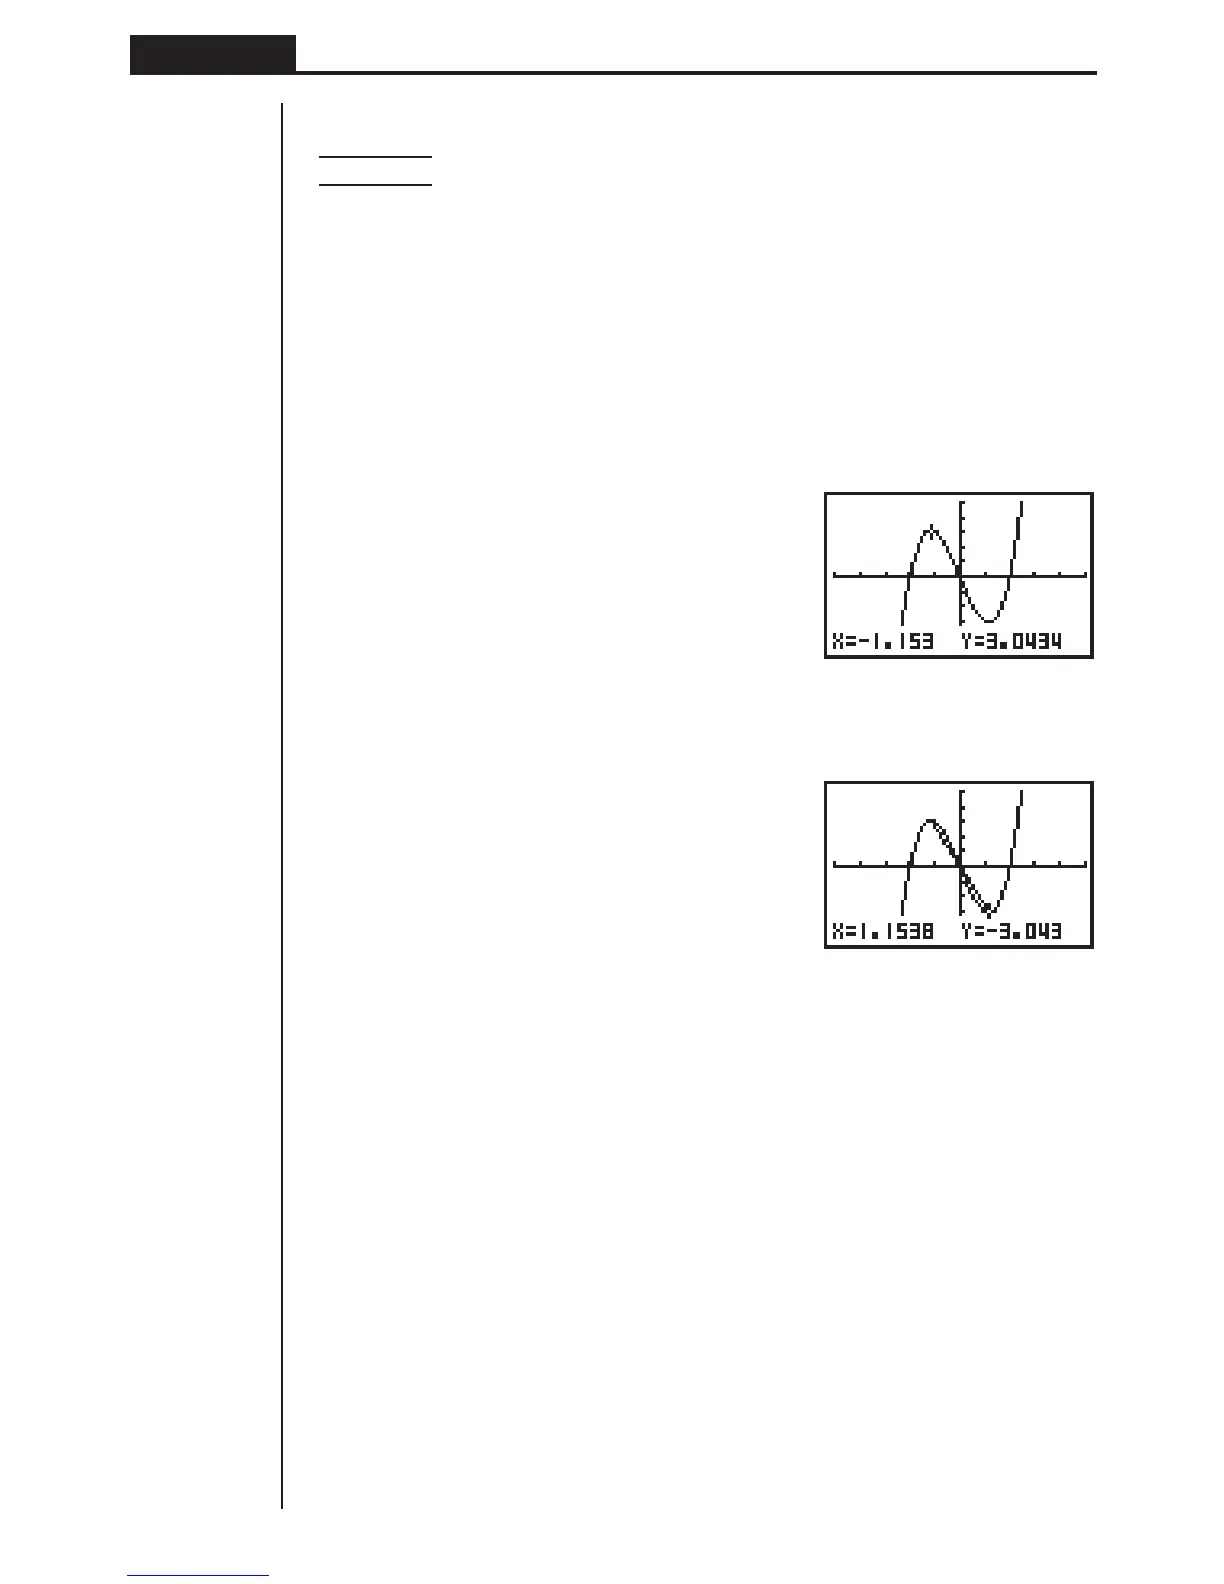
Example To draw a line between two points of inflection on the graph of
y = x(x + 2)(x – 2)
1. After graphing the function, display the sketch menu and perform the following
operation to cause the pointer to appear on the graph screen.
!4(SKTCH)4(LINE)2(F-Lin)
2. Use the cursor keys (f, c, d, e) to move the pointer to one of the points of
inflection and press w.
d ~ df ~ f
w
3. Use the cursor keys to move the pointer to the other point of inflection and press
w to draw the line.
e ~ ec ~ c
w
uu
uu
uTo draw a line in the RUN or PRGM Mode
The following is the syntax for drawing lines in these modes.
F-Line <
x-coordinate 1>, <y-coordinate 1>, <x-coordinate 2>, <y-coordinate 2>