69
Graphing Chapter 4
uu
uu
uTo draw a line between two plotted points
In the STAT, GRAPH or TABLE Mode
Example To draw a line between the two points of inflection on the graph
of
y = x(x + 2)(x – 2)
Use the same View Window parameters as in the example on page
66.
1. After graphing the function, display the sketch menu and perform the following
operation to cause the pointer to appear on the graph screen.
!4 (SKTCH)3(PLOT)1(Plot)
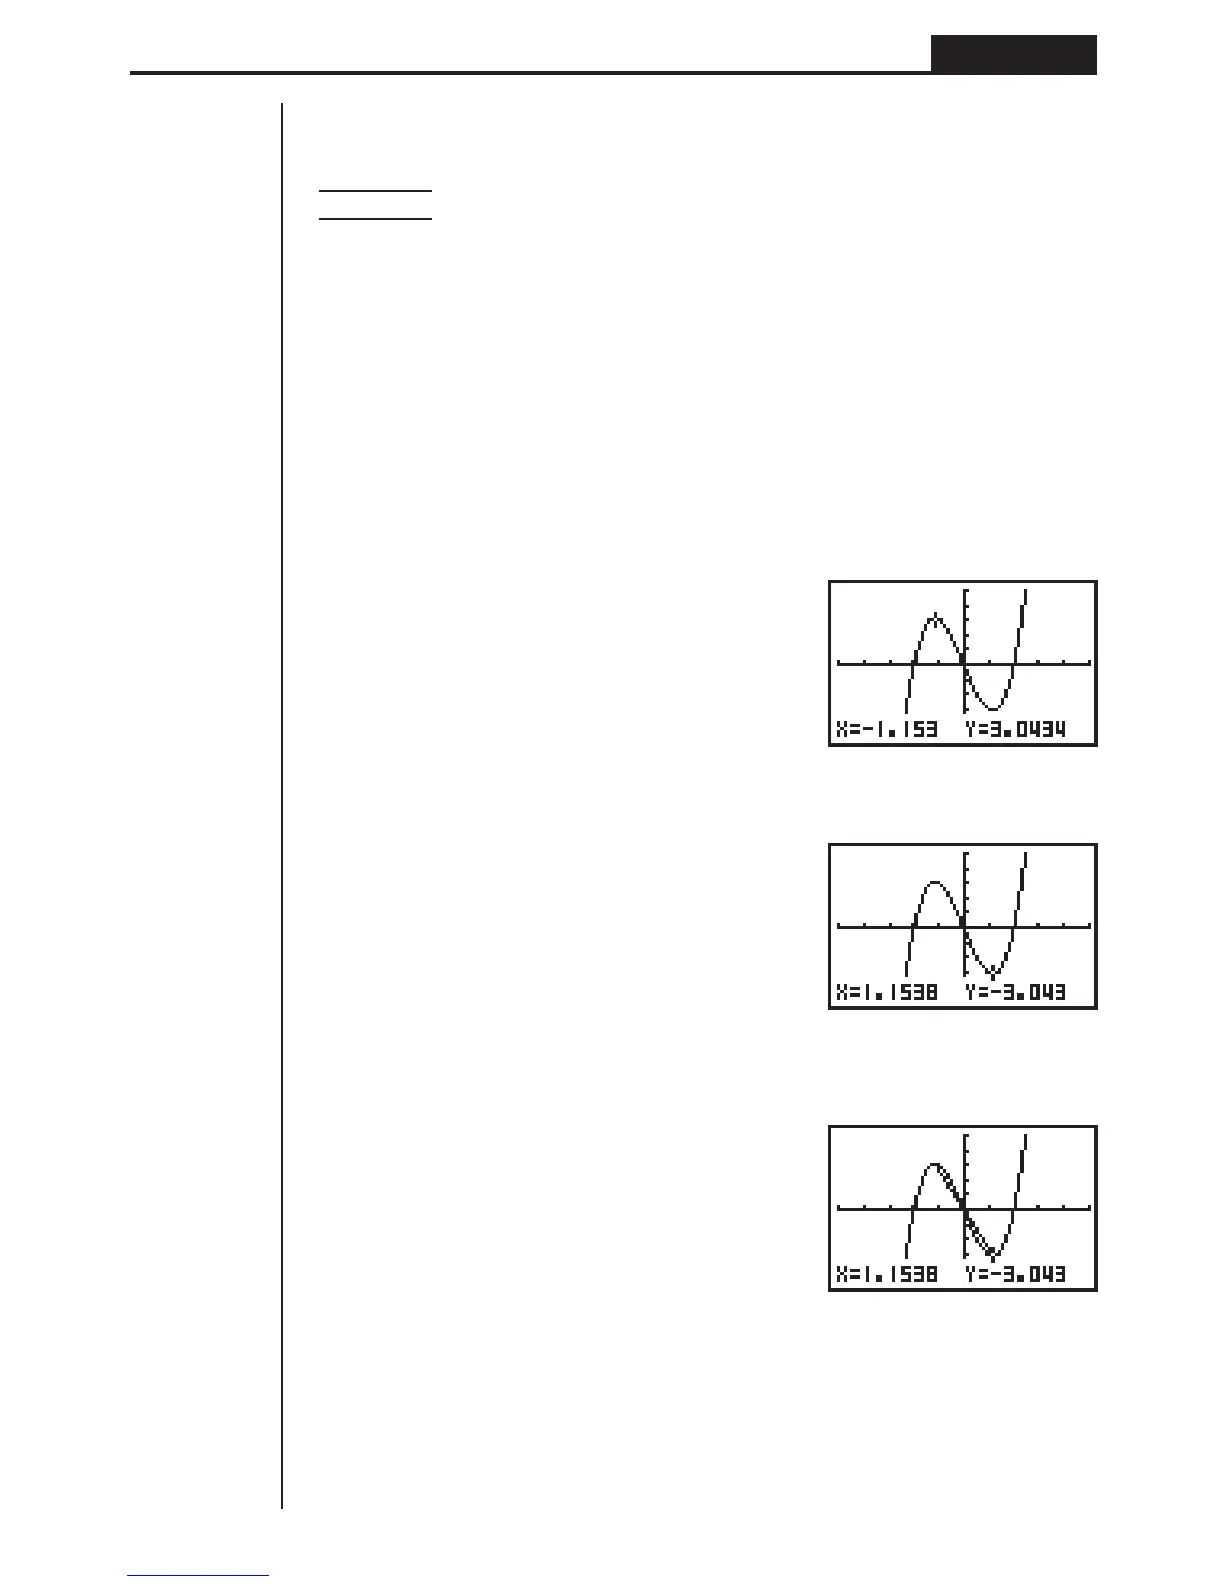
2. Use the cursor keys (f, c, d, e) to move the pointer to one of the points of
inflection and press w to plot it.
d ~ df ~ f
w
3. Use the cursor keys to move the pointer to the other point of inflection.
e ~ ec ~ c
4. Display the sketch menu and perform the following operation to draw a line be-
tween the two points.
!4(SKTCH)4(LINE)1(Line)